Occasions of eye health services – Visiting Optometrists Scheme (VOS)
Measure 4.4.1: The number of occasions of service for Indigenous Australians with eye health professionals, per 1,000 population, under the Visiting Optometrists Scheme (VOS).
Outreach programs are designed to address the uneven distribution of the health workforce and to improve access to eye health services across Australia.
Figure 4.4.1: Occasions of eye health services – Visiting Optometrists Scheme (VOS)
There are 5 separate charts for this measure showing the number and rate per 1,000 population for VOS occasions of service, by various characteristics.
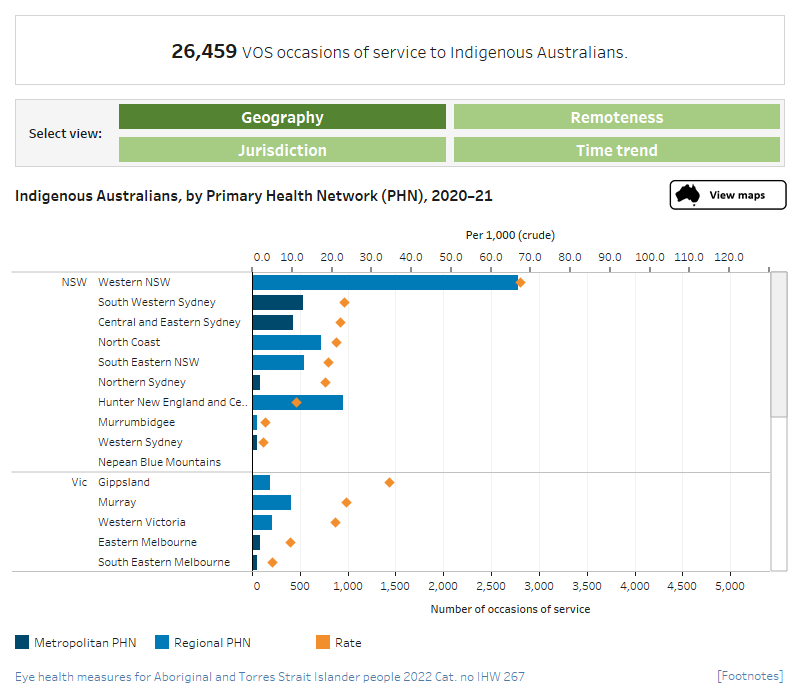
VOS occasions of service, Indigenous Australians by PHN, 2020–21 (barchart)
This dual axis combined horizontal bar chart and scatter plot presents the number and rate of VOS occasions of service per 1,000 population, by PHN. PHNs have been grouped by state and are ranked from highest to lowest rate within each state grouping. In NSW the PHN with the highest rate of occasions of service per 1,000 was Western NSW (68 per 1,000). Western Sydney has the lowest rate (3.0 FTE per 1,000).
In Victoria the PHN with the highest rate of occasions of service per 1,000 was Gippsland (34.5 FTE per 1,000). North Western Melbourne has the lowest rate at 5.2 FTE per 1,000.
VOS occasions of service, Indigenous Australians, by region, 2020–21
This vertical bar chart shows the number of VOS occasions per 1,000 population for Indigenous Australians in 2020–21. Very remote regions have the highest rate (120.9 per 1,000) and Major cities have the lowest rate (9.9).
VOS occasions of service, by Indigenous status and jurisdiction, 2020–21
This grouped vertical bar chart compares the number of VOS occasions of service in 2020–21, by Indigenous status and jurisdiction. The chart shows that the number of Indigenous occasions of service under the VOS was lowest in Tasmania (170), followed by Victoria (998), while the highest number was seen in Queensland (8,227) followed by the NSW/ACT (6,358).
VOS occasions of service, time trend, 2009–10 to 2020–21
This multiple line graph shows the number of occasions of service under the VOS in 2009–10 to 2020–21, by Indigenous status. The chart shows that, in 2009–10, there were 6,975 occasions of service for Indigenous patients under the VOS. This increased to 29,161 in 2017–18 and has since dipped to 26,459 in 2020–21.
VOS occasions of service, Indigenous Australians by jurisdiction, 2019–20
This vertical bar chart compares the rate of VOS occasions of service per 1,000 Indigenous Australians in 2019–20, by state and territory. The chart shows that the rate of Indigenous occasions of service was highest in the Northern Territory (56 per 1,000) followed by Western Australia (38 per 1,000).

- In 2020-21, there were 26,459 occasions of service for Indigenous patients and 22,676 for other patients under the VOS.
- In 2020-21, the rate of Indigenous occasions of service was highest in the Northern Territory (66 per 1,000), followed by Western Australia (37 per 1,000).
- In 2009–10, there were around 6,975 occasions of service for Indigenous patients under the VOS. This increased to 29,161 in 2017–18 before declining to 26,459 in 2020-21. In 2020-21 Indigenous Australians had around 3,800 more VOS occasions of service than other Australian patients.


