Types of animals

Of hospitalised injury cases due to contact with animals, 53% were due to common pets (cats and dogs), 21% due to livestock, 22% to wildlife and under 3% due to marine animals (Figure 7). Over 80% of injuries were caused by non-venomous animals (Table 3). In about 2% of cases the type of animal associated with the injury was not specified.

  • Total contact with animals

    • 23,379 cases
    • 100% of total contact with animals
    • 4.3% of total injuries in Australia
    • 90.4 cases per 100,000 people
  • Bitten or struck by dog 

    • 9,542 cases or 36.9 per 100,000 persons
    • 40% of total contact with animals
    • 1.8% of total injury hospitalisations
  • Bitten or struck by other mammals 

    • 4,924 cases or 19 per 100,000 persons
    • 21.1% of total contact with animals
    • 0.9% of total injury hospitalisations
  • Animal-rider or occupant of animal-drawn vehicle injured in transport

    • 3,226 cases or 12.5 per 100,000 persons
    • 13.8% of total contact with animals
    • 0.6% of total injury hospitalisations
  • Bitten or crushed by other reptiles 

    • 1,829 cases or 7.1 per 100,000 persons
    • 7.8% of total contact with animals
    • Under 1% of total injury hospitalisations
  • Contact with allergens, allergy to animals 

    • 1,176 cases or 4.5 per 100,000 persons
    • 5% of total contact with animals
    • Under 1% of total injury hospitalisations
  •  Bitten or stung by nonvenomous insect and other nonvenomous arthropods

    • 544 cases or 2.1 per 100,000 persons
    • 2.3% of total contact with animals
    • Under 1% of total injury hospitalisations
  • Contact with venomous snakes and lizards 

    • 539 cases or 2.1 per 100,000 persons
    • 2.3% of total contact with animals
    • Under 1% of total injury hospitalisations
  • Contact with spiders 

    • 474 cases or 1.8 per 100,000 people
    • 2% of total contact with animals
    • Under 1% of total injury hospitalisations
  • Contact with venomous marine animals

    • 302 cases or 1.2 per 100,00 persons
    • 1.3% of total contact with animals
    • Under 1% of total injury hospitalisations
  • Contact with other venomous arthropods

    • 280 cases or 1.1 per 100,000 persons
    • 1.2% of total contact with animals
    • Under 1% of total injury hospitalisations
  • Contact with marine animal

    • 223 cases or 1.1 per 100,000 persons
    • 1.2% of total contact with animals
    • Under 1% of total injury hospitalisations
  • Contact with hornets, wasps and bees

    • 201 cases or 0.8 per 100,000 persons
    • Under 1% each of total contact with animals and total injury hospitalisations
  • Contact with birds

    • 52 cases or 0.2 per 100,000 persons
    • Under 1% each of total contact with animals and total injury hospitalisations
  • Bitten or struck by crocodile or alligator

    • 26 cases or 0.1 per 100,000 persons
    • Under 1% each of total contact with animals and total injury hospitalisations
  • Bitten by rat

    • 22 cases or under 1 per 100,000 persons
    • Under 1% each of total contact with animals and total injury hospitalisations
  • Contact with other specified venomous animals

    • 11 cases or under 1 per 100,000 persons
    • Under 1% each of total contact with animals and total injury hospitalisations
  • Contact with centipedes and venomous tropical millipedes

    • 5 cases
  • Contact with scorpions

    • 3 cases

The number and percent of cases by animal type varied by gender, with more females being injured by common pets and livestock. More adults were injured across animal types than were children, and the majority were from major cities of inner regional areas (Figure 7). 

Figure 7: Number and percent of injury hospitalisations by type of animal, sex, age group and remoteness, 2021-22

Interactive bar graphs displaying number and percent of injury hospitalisations by age, remoteness and sex.

Rates of injury hospitalisation varied by the type of animal involved, with females having higher rates of injury from domestic animals and males more commonly injured by wildlife or marine animals. 45–64-year-olds had the highest rates overall apart from livestock and marine animal related injury hospitalisations, where rates were higher for 15–24-year-olds. Rates of injury hospitalisations increased with remoteness for all animal types except pets, where they peaked in remote regions as opposed to very remote regions (Table 4.1-4.3).

Table 4.1: Crude rate (per 100,000 persons) of injury hospitalisations due to contact with animals by animal category and sex, Australia, 2021–22


Common pets

Livestock

Wildlife (excluding marine animals)

Marine animals

Other and unspecified

Total

Male

42.4

12.6

23.6

2.8

2.2

83.6

Female

52.6

26.3

15

1.3

2

97.1

Persons

47.5

19.5

19.3

2

2.1

90.4

Source: National Hospital Morbidity Database (NHMD)

Table 4.2: Crude rate (per 100,000 persons) of injury hospitalisations due to contact with animals by animal category and age group, Australia, 2021–22

Common pets

Livestock

Wildlife (excluding marine animals)

Marine animals

Other and unspecified

Total

0–4

41.8

3

18.7

0.5

1.7

65.7

5–14

33

14.8

15.1

3

1.2

67.1

15–24

43.9

32.3

16.8

3.4

2.8

99.3

25–44

50.4

18.9

20.4

2.2

1.7

93.5

45–64

56.8

24.9

23.4

1.9

2.6

109.6

65+

44.8

12.5

16.6

0.9

2.6

77.3

Source: National Hospital Morbidity Database (NHMD)

Table 4.3: Crude rate (per 100,000 persons) of injury hospitalisations due to contact with animals by animal category and region, Australia, 2021–22


Common pets

Livestock

Wildlife (excluding marine animals)

Marine animals

Other and unspecified

Total

Major city

44.7

8.3

11.6

1.3

1.3

67.2

Inner regional

53.8

44.7

31.3

1.8

4.1

135.7

Outer regional

50.5

48.1

47.6

5.7

4.1

156.1

Remote

71.1

73.8

65.8

14.3

4.3

229.4

Very remote

64.8

91.9

80.6

13.8

7.7

258.8

Source: National Hospital Morbidity Database (NHMD)

Figure 8: Activity and place of injury by animal type, 2021-22

Interactive heatmap displaying the number of injury hospitalisations by animal type, activity at time of injury and place of occurrence. Most injuries occur in homes.

Trends

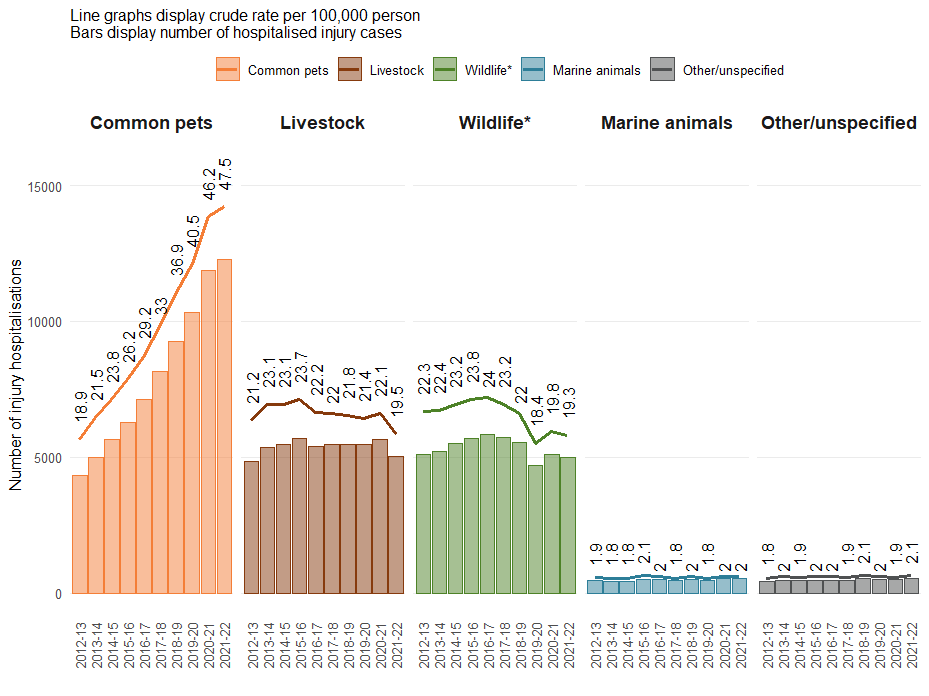
Over the past decade, the biggest increase in hospitalised injuries was observed where common pets were involved, with crude rates per 100,000 persons rising by about 2.5 times, from 18.9 in 2012-13 to 47.5 in 2021-22. The numbers and rates of hospitalised injuries due to common pets have been higher than those caused by the next closest category (livestock) since 2014-15. Injury hospitalisations associated with all other animal types decreased or remained static during the decade (Figure 9).

Figure 9: Number and crude rate (per 100,000 persons) of injury hospitalisations by animal type, 2012-22

graphs showing the greatest increases between 2012-13 and 2021-22 occurred in injury hospitalisations related to common pets, with a rate of 47.5 per 100,000 in 2021-22 from 18.9 in 2012-13.Every other animals type had much lower numbers and rates; 19.5 for livestock, 19.3 wildlife, 2 marine animals and 2.1 for other animals during 2021-22.

Source: National Hospital Morbidity Database