Wildlife and venomous animals
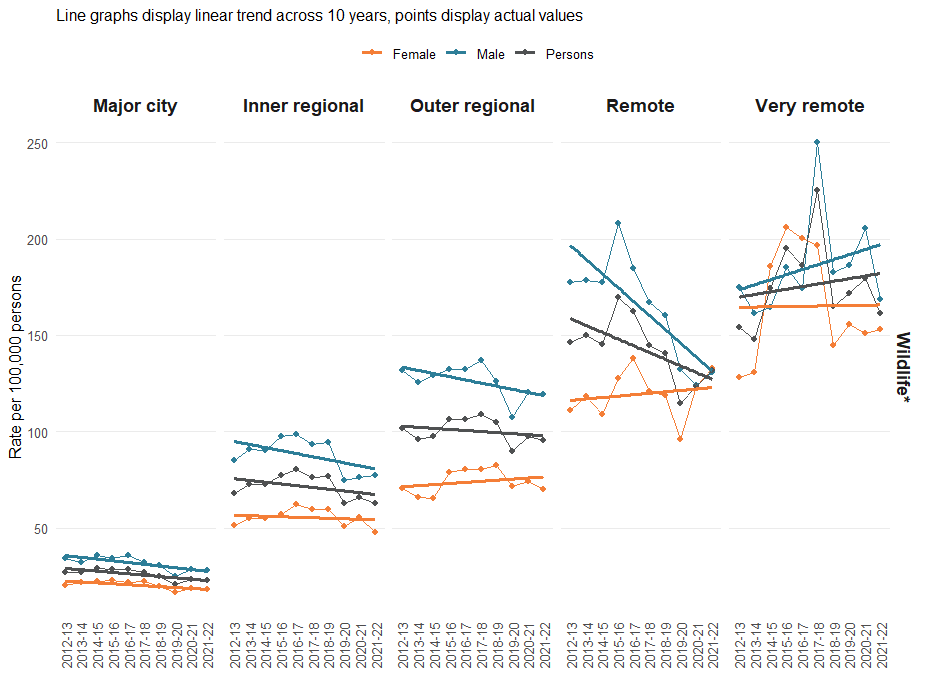
Wildlife-related injury hospitalisations have been decreasing since 2012 across all ages, and sexes and regions (Figure 15). Rates of these injuries are highest among males and in very remote regions (Table 4). Injuries frequently occur at home and during work activity (Figure 8). For more information, please refer to supplementary data table 3.
Figure 15: Crude rates of injury hospitalisations related to wildlife, by region, Australia, 2012-22
Notes:
* Excluding marine animals, including venomous wildlife
For each region, crude rates along the y-axis are calculated using the total estimated regional population as denominators.
Source: National Hospital Morbidity Database
Venomous animals
In 2021-22 venomous animals contributed to less than 1% of all cause injury hospitalisations across Australia. The number of injury hospitalisations due to venomous animals decreased to 2,867 in 2021-22 from 3,520 in 2017-18. Published research indicated 39,619 hospitalised injuries due to venomous animals over the 11 years between August 2001 and May 2013, an average of about 3,600 cases a year (Welton, Williams et al. 2017).
In 2021-22, the crude rate of injury hospitalisations due to venomous animals was 11.1 per 100,000, as compared to 72.8 per 100,000 for non-venomous animals. In 2017-18 this rate was 14.2 per 100,000 people (AIHW 2021). For more information, please refer to supplementary data tables 6 and 7.
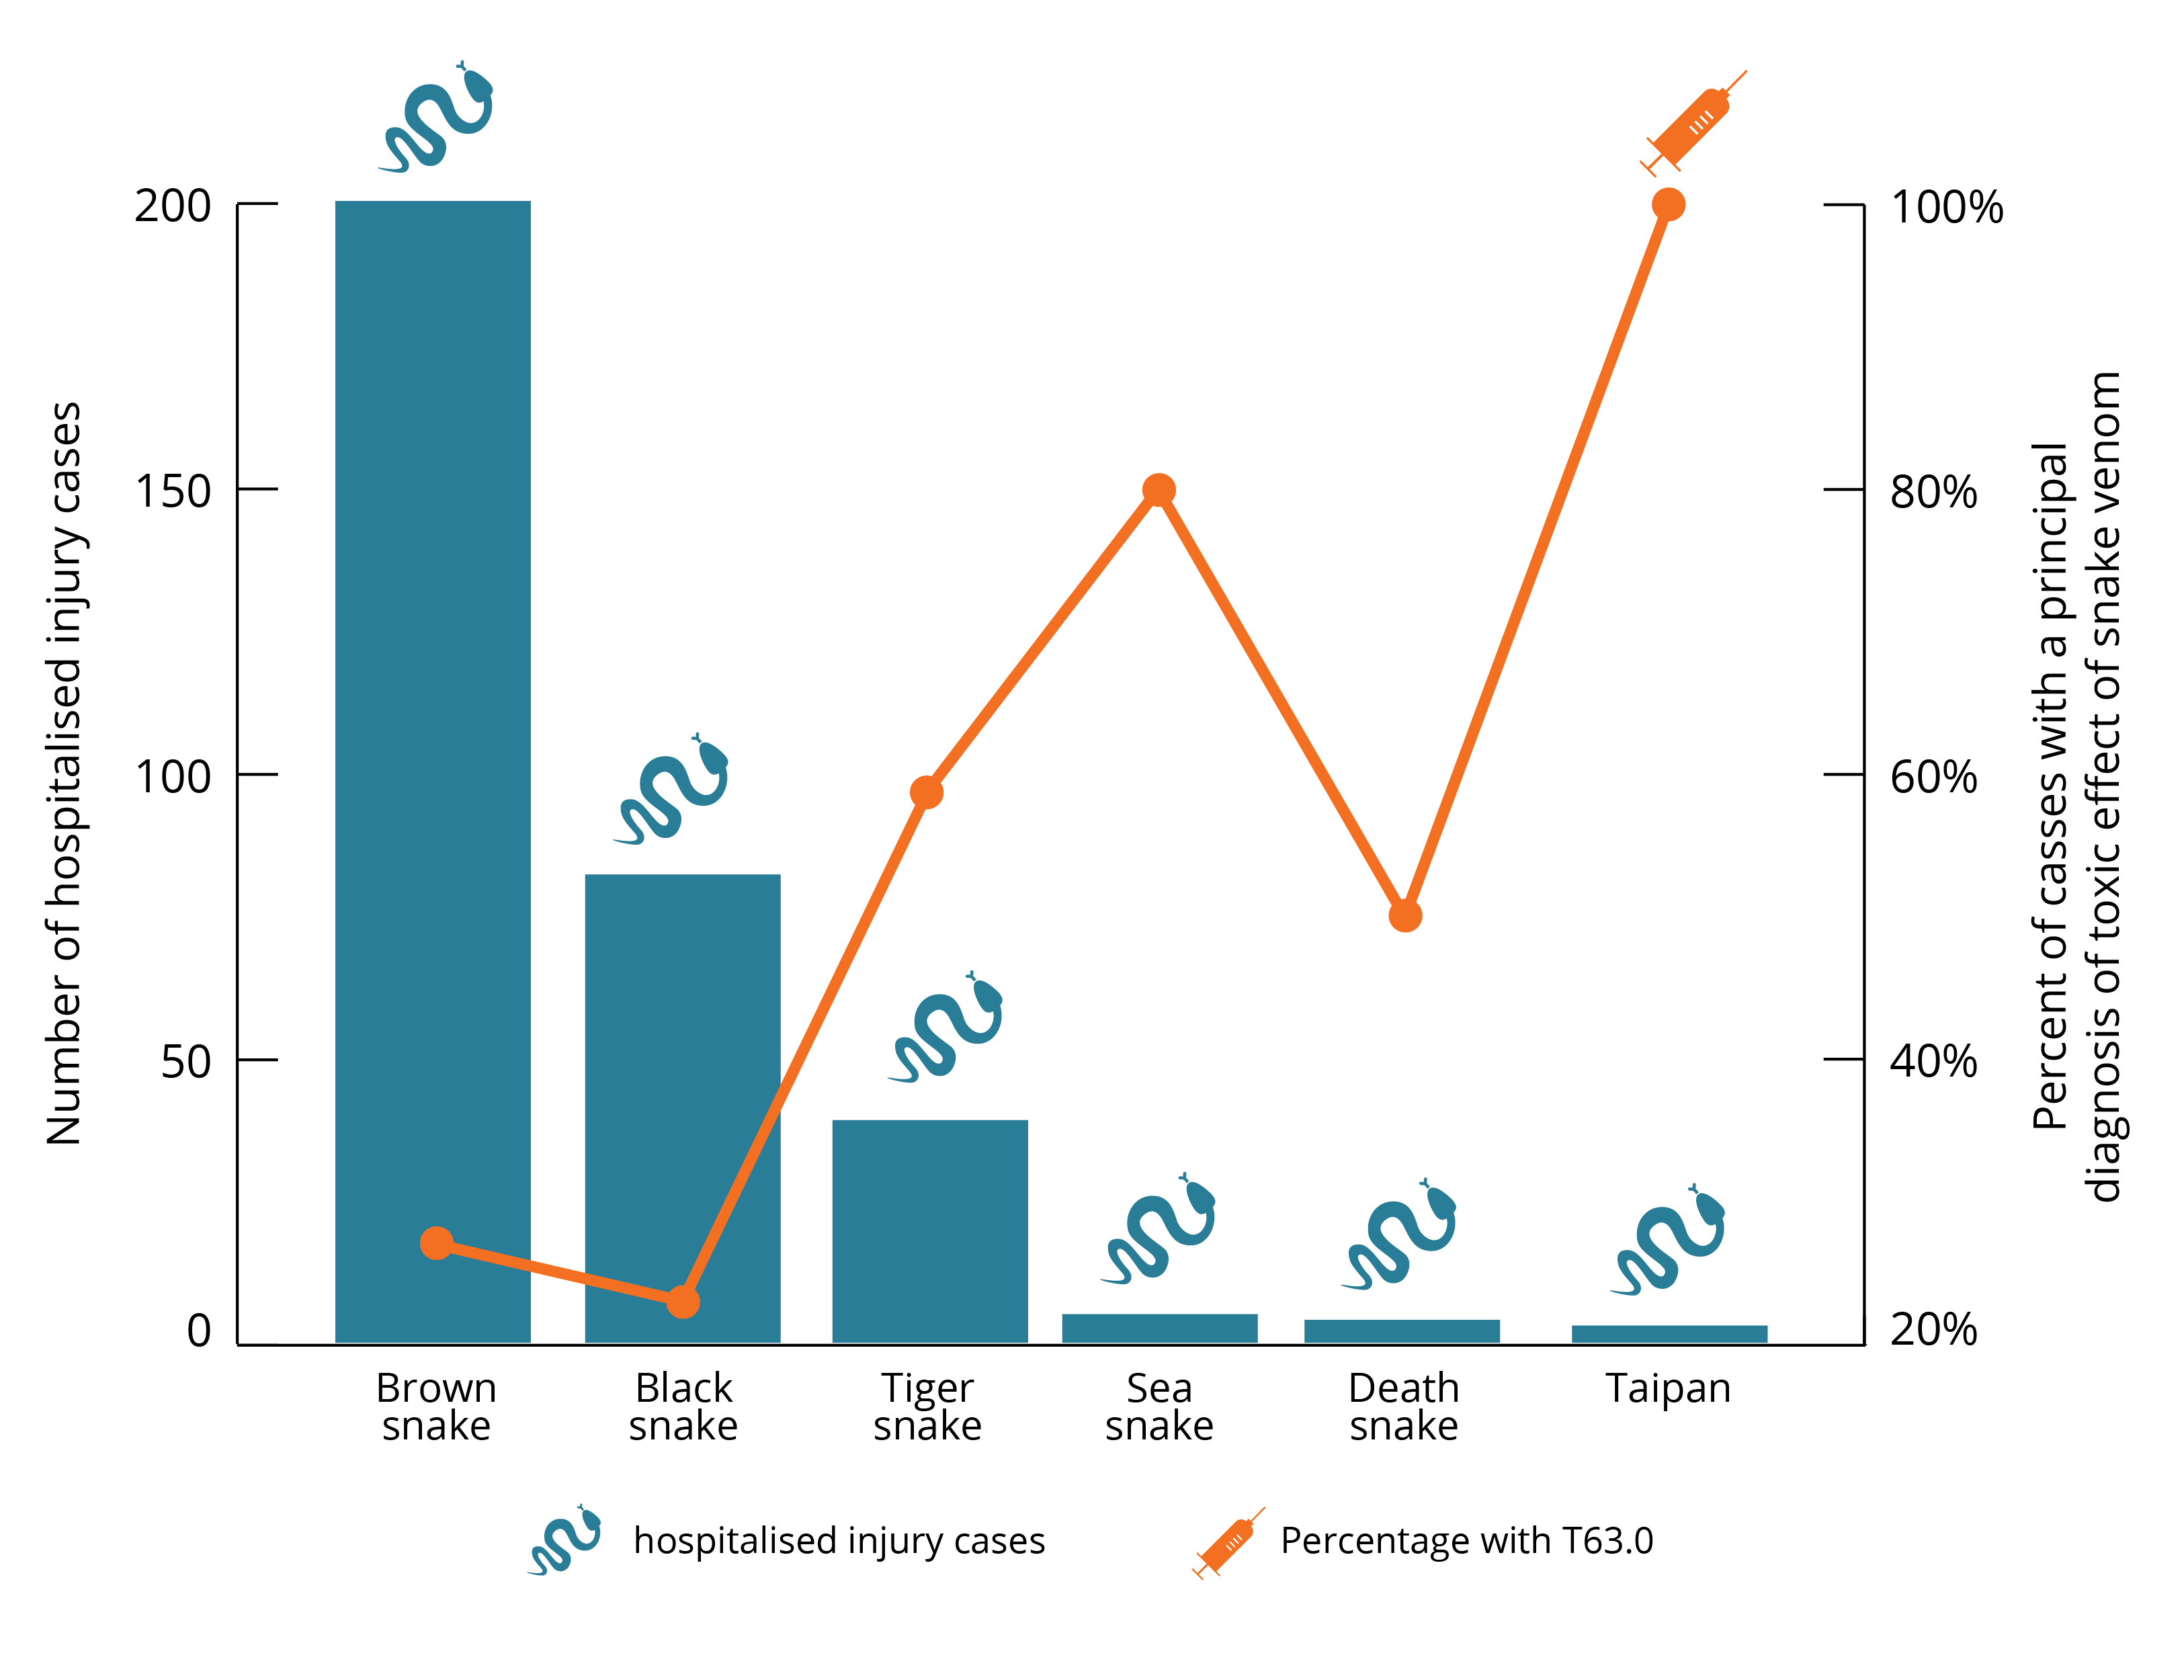
Figure 16: The top 5 ranked causes of the 2,867 injury hospitalisations caused by venomous animals, 2021-22
Of the 2,867 injuries from venomous animals, more than 60% of hospitalised cases were males (1,782 cases, 13.9 per 100,000). Most cases were adults with the highest rate being 14.4 per 100,000 among 45–64-year-olds. For more information, please refer to supplementary data table 6.
More than 50% of incidents (1,468 cases) did not have place of occurrence specified, but where it was, most venomous injuries occurred in homes (796 cases or 27%, of which 788 cases were caused by wildlife). Likewise, most incidents did not have a specific activity noted (2,041 cases or 71%) but where it was, work was the most frequent activity being undertaken during these incidents (414 cases or 14%). In two thirds of these cases (281 cases) the affected person was engaged in work that may not be associated with an income (for example, caring roles at home) (Figure 8). For more information, please refer to supplementary data table 8.
Trends
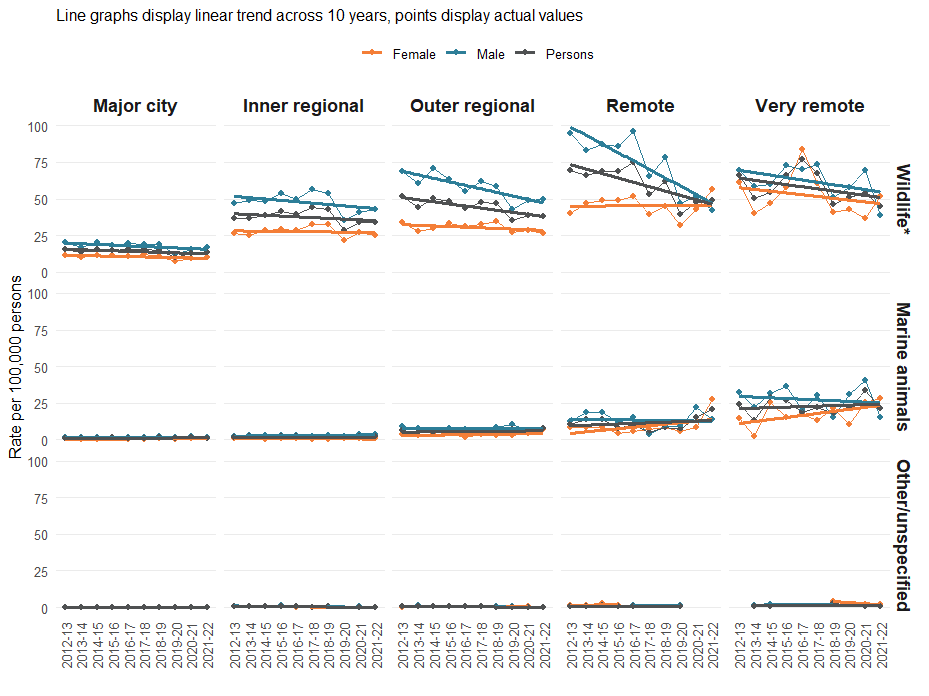
Injury hospitalisations associated with all venomous animals have remained relatively stable across Australia since 2012-13. 45–64-year-olds remain the most likely age group to be hospitalised for these injuries (Figure 17). Rates of hospitalisation increased with remoteness (Figure 18). Those associated with venomous wildlife have decreased across all age groups and regions (Figure 18). For more information, please refer to supplementary data table 2.
Figure 17: Heatmap of crude rate (per 100,000) of injury hospitalisations due to contact with venomous animals by age, Australia, 2012–13 to 2021–22
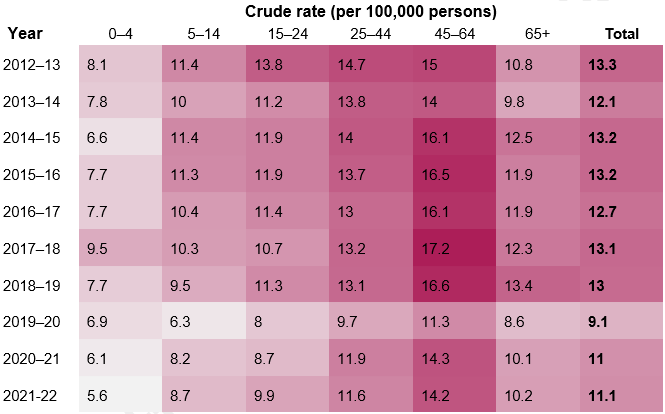
Source: National Hospital Morbidity Database
Figure 18: Venomous animal related rates of injury hospitalisations, by region and venomous animal type, Australia, 2012-22
Notes:
* Excluding marine animals. Wildlife here represents only venomous wildlife.
For each region, crude rates along the y-axis are calculated using the total estimated regional population as denominators.
Source: National Hospital Morbidity Database
Envenomation is described further under Types of injuries and Envenomation and antivenom.