Where are people injured?
The distribution of different animals and therefore injury patterns vary by place of occurrence. More bee-related anaphylaxes are reported in South Australia, more snake bites in Queensland and jack jumper ant anaphylaxes in Tasmania (Australian Venomous Injury Project 2023). Venomous animal injuries vary significantly by remoteness regions across states and territories, indicating the need for localised prevention approaches (Welton, Williams et al. 2017). Across Australia, people are about 6.6 times as likely to be hospitalised due to injury involving a non-venomous animal as they were from a venomous animal, however states and territories varied widely, with this risk being 14.4 times in the ACT and 3.4 times in SA.
Place of occurrence
Across the decade of data analysed in this report;
- place of occurrence of injury most frequently went unrecorded
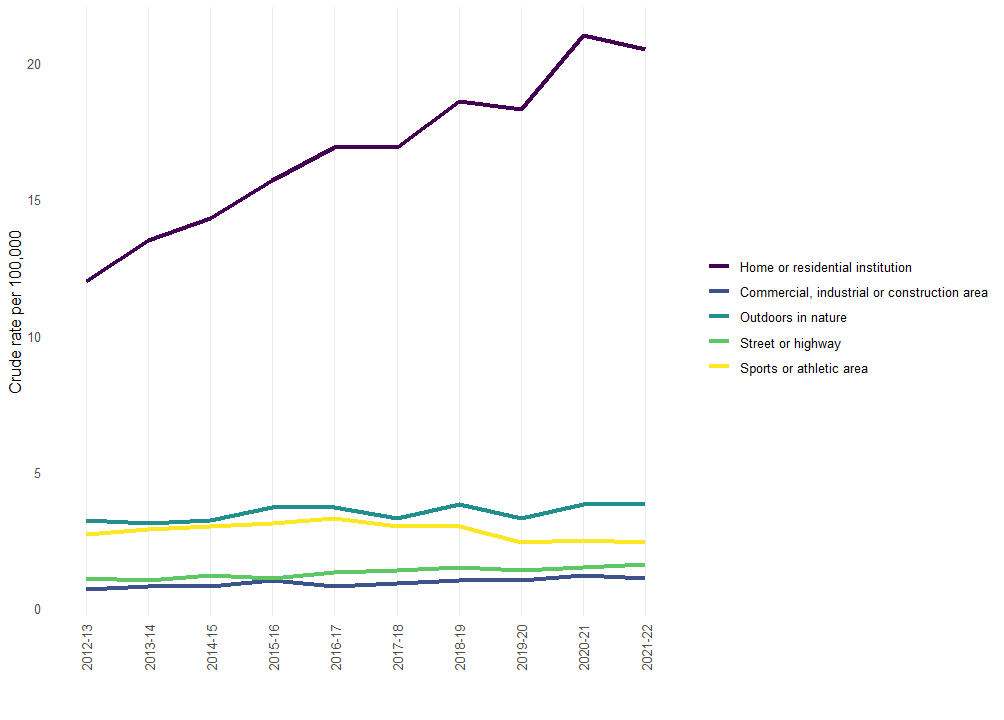
- the number of hospitalisations generally increased by year across place categories (Figure 5).
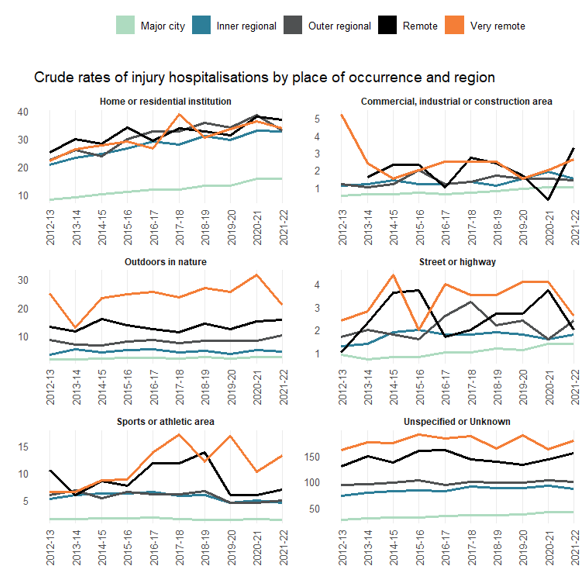
Of named places of occurrence of injury, the highest numbers and rates of hospitalisation occurred in homes, followed by outdoors or in nature (including natural bodies of water, bushland, deserts and other countryside). Rates varied by region within each place of occurrence, generally increasing as population size decreased with remoteness. For injuries that occurred in homes or residential institutions, similar rates were observed for all regions apart from major cities, where they were lower. Comparatively, rates of unspecified injuries, or those occurring outdoors or in nature increased clearly with remoteness, being highest in very remote regions. Rates of injuries occurring in sports or athletic areas were similar for major cities and regional areas and notably higher in remote and very remote regions (Figure 5).
Figure 5.1: Injury hospitalisations by place of occurrence and remoteness, 2012-22
Source: National Hospital Morbidity Database
Figure 5.2: Injury hospitalisations by place of occurrence and remoteness, 2012-22
Source: National Hospital Morbidity Database
Region
Trends over the decade indicate that most of the growth in numbers of these hospitalised injuries is from major cities, with relatively static case counts in other regions (Figure 5, Table 2). This held true regardless of place of occurrence, except for sports or athletic areas, where the numbers of these hospitalised injuries decreased overall from 2019-20.
Over the past decade there has been a generally increasing trend in rates of these injuries within each region, with these rates also increasing with remoteness. Increased rates in remoter regions may reflect higher proportions of residents working in agriculture or other industries where one is more likely to be outdoors or around animals.
Year | Major cities | Inner regional | Outer regional | Remote | Very remote |
|---|---|---|---|---|---|
2012-13 | 6,712 (41.2) | 4,472 (108.5) | 2,741 (137.3) | 560 (183.1) | 489 (229.8) |
2013-14 | 7,366 (44.4) | 4,937 (118.4) | 2,853 (141.9) | 621 (203.6) | 487 (230.8) |
2014-15 | 8,076 (47.8) | 5,213 (123.8) | 2,855 (141.4) | 613 (203.1) | 507 (245.1) |
2015-16 | 8,615 (50) | 5,496 (129.3) | 3,133 (154.7) | 670 (224.9) | 540 (265.8) |
2016-17 | 9,331 (53.1) | 5,571 (129.5) | 3,049 (149.9) | 660 (223.2) | 533 (265.5) |
2017-18 | 9,766 (54.6) | 5,908 (135.5) | 3,184 (155.7) | 622 (210.3) | 566 (284.5) |
2018-19 | 10,583 (58.2) | 6,110 (138.2) | 3,238 (157.6) | 628 (212) | 502 (254) |
2019-20 | 10,892 (59) | 5,999 (133.9) | 3,168 (153.3) | 568 (190.9) | 552 (280.7) |
2020-21 | 12,476 (67.2) | 6,501 (143.3) | 3,357 (161.6) | 644 (215.2) | 504 (257.3) |
2021-22 | 12,542 (67.2) | 6,234 (135.7) | 3,265 (156.1) | 690 (229.4) | 507 (258.8) |
Source: National Hospital Morbidity Database
State and territory
The largest number of cases during 2021-22 were from Queensland, which also reported the highest number of injury hospitalisations due to contact with venomous animals (Table 3).
Table 3: Number of injury hospitalisation cases due to contact with animals, by state and territory and venomous type, 2021-22
States & Territories | Venomous | Non-venomous | Total contact with animals(a) |
|---|---|---|---|
NSW | 624 | 4,916 | 5,753 |
Vic | 564 | 4,593 | 5,364 |
Qld | 892 | 5,003 | 6,805 |
WA | 338 | 1,842 | 2,347 |
SA | 312 | 1,038 | 1,415 |
Tas | 76 | 339 | 434 |
ACT | 37 | 540 | 581 |
NT | 38 | 476 | 583 |
Australia | 2,887 | 18,825 | 23,379 |
Notes:
(a) ‘Total contact with animals’ includes records where venomousness of animal could not be determined.
Source: National Hospital Morbidity Database
Age standardised rates (ASRs) per 100,000 present a population level risk of injury hospitalisation adjusted for different age distributions across states and territories. ASRs indicate that people from the NT (232.7), Queensland (129.8) and the ACT (127) are most likely to be hospitalised due to any animal-related injuries, and those from SA (17.1), Queensland (16.9), and the NT (15.2) for venomous animal-related injuries (Figure 6).
Figure 6: Age standardised rate of injury hospitalisations due to contact with animals, by state and territory, 2021-22
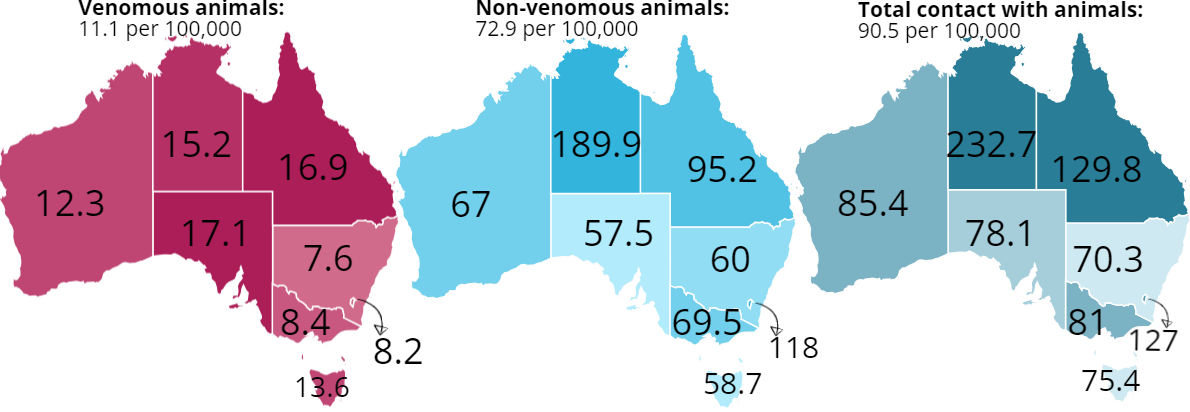
Source: National Hospital Morbidity Database
Across Australia, people are about 6.6 times as likely to be hospitalised due to injury involving a non-venomous animal (72.9 per 100,000) as they were from a venomous animal (11.1 per 100,000), however states and territories varied widely, with this risk ranging from 14.4 times in the ACT to 3.4 times in SA (Figure 6).