Patient experiences by age and sex
Self-assessed health status and the presence of long-term health conditions are both indicators of patient health. While most Australian adults rate their health positively, health status can vary by age and sex.
The proportion of Australian adults who rated their health as excellent, very good or good declined with increasing age. Conversely, the proportion who reported they had a long-term condition increased with age. While there was very little difference between males and females in self rated health, in all age groups, females were more likely than males to report they had a long-term condition.
Patient experiences of care varied by sex
The reporting of positive patient experiences varied by sex of Australian adults. Within the three patient experience satisfaction measures (listened carefully, showed respect and spent enough time with), a slightly higher proportion of males reported positive experiences with their GP than females. In contrast, a higher proportion of females reported they waited longer than acceptable to get an appointment with a GP, and could not access their preferred GP, compared with males.
Positive patient experiences increased with age
The proportion of patients who reported positive experiences with their general practitioner (GP) across the three patient experience satisfaction measures generally increased with patient age. In contrast, the proportion of patients who did not see, or delayed seeing a GP or a dentist due to cost declined with age.
Explore age and sex breakdowns for selected measures
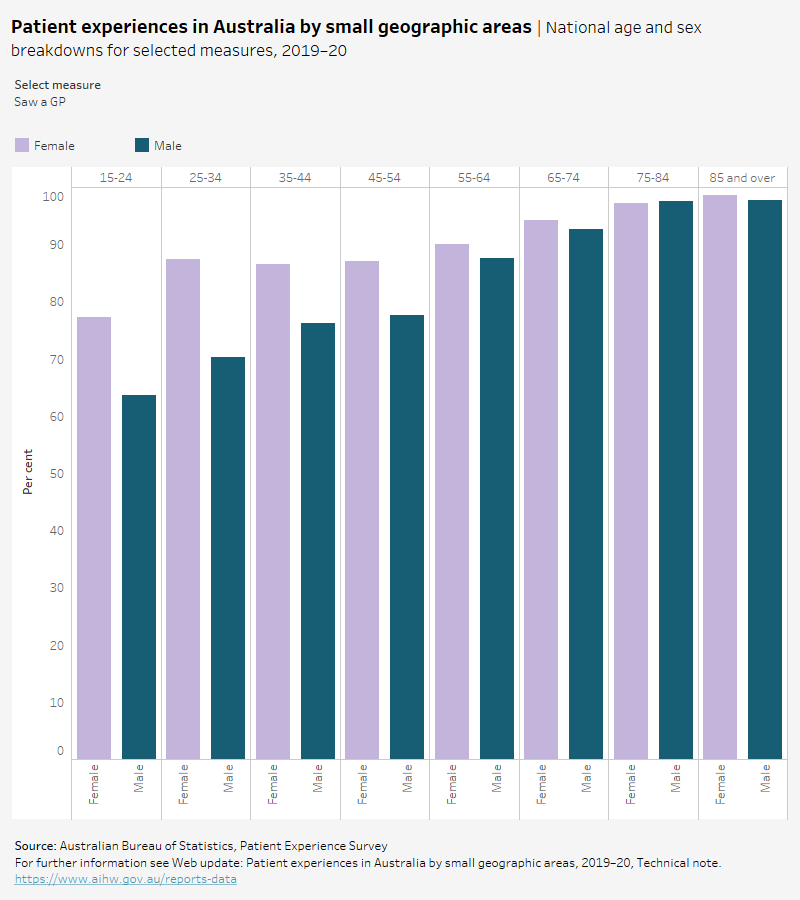
This visualisation presents national information on people’s experiences with the health care system, disaggregated by age and sex. Data are presented for selected measures, providing a national overview of findings from the Australian Bureau of Statistics’ Patient Experience Survey 2019–20. Further information on the Patient Experience Survey and what is included can be found in the technical note.
This column chart presents national results for 10 selected measures, disaggregated by age and sex. The graph is able to be filtered by measure, and displays results for males and females aged 15-24 to 85 and over. Data used to create this visualisation can be found in the data tables.


