Patient experiences in Australia by PHN
In this section, results from the Australian Bureau of Statistics’ Patient Experience Survey 2019–20 are presented for the 31 Primary Health Network (PHN) areas across Australia. Results are also included, where available, from the patient experience surveys conducted in 2013–14, 2014–15, 2015–16, 2016–17, 2017–18 and 2018–19. Aside from a small amount of fluctuation, patient experiences at the national level have remained similar over the period 2013–14 to 2019–20.
Most recently in 2019–20, the data reveal:
- Nationally, 88% of Australian adults rated their health as excellent, very good or good; similar to previous years. Across PHN areas, this percentage ranged from 81% in Country SA to 93% in Northern Sydney.
- Around half (52%) of adults reported having a long-term health condition. Across PHN areas, this percentage ranged from 39% in Western Sydney to 65% in North Coast. The Northern Territory had the lowest percentage of adults who reported having a long-term health condition across the PHN areas (38%) but due to the Indigenous Community Strata not being included in the sample, these data should be interpreted with caution.
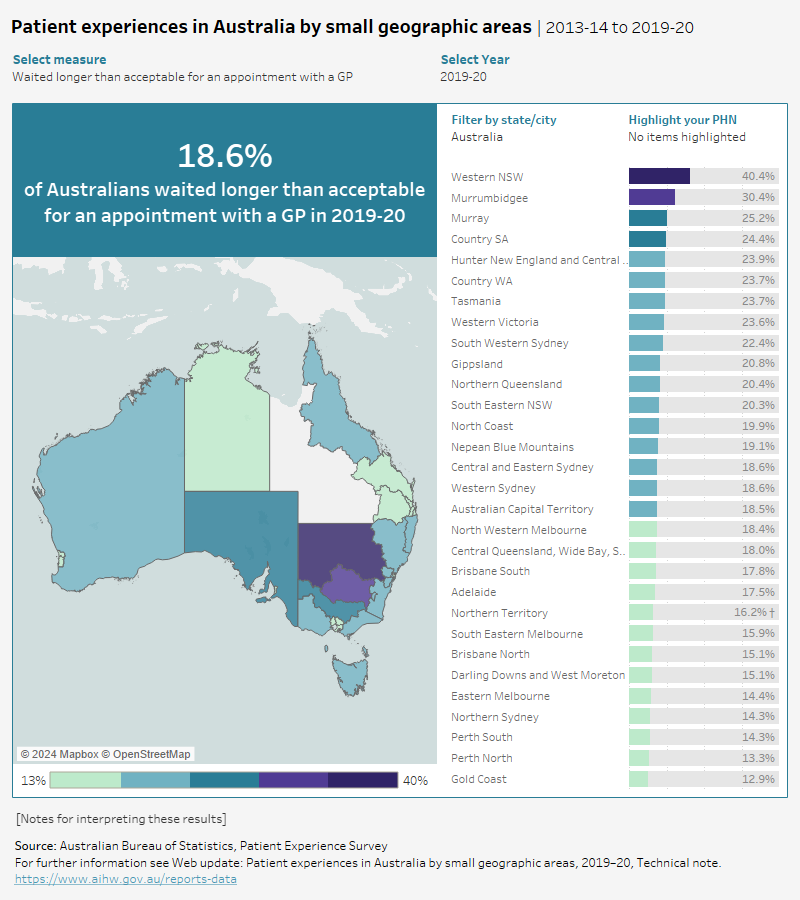
- Almost 1 in 5 (19%) adults felt they waited longer than acceptable to get an appointment with a GP in 2019–20. Across PHN areas, this percentage ranged from 13% in the Gold Coast to 40% in Western NSW.
- Almost 1 in 4 (23%) adults referred to a medical specialist waited longer than they felt acceptable to get an appointment in the previous 12 months. Across PHN areas, this percentage ranged from 17% in Nepean Blue Mountains to 30% in North Coast. South Eastern NSW had the highest percentage of adults referred to a medical specialist and waited longer than they felt acceptable across the PHN areas (30%), but due to high relative standard error, these data should be interpreted with caution.
- Less than 1 in 20 (3.8%) adults delayed or did not see a GP due to cost in the preceding 12 months. Across PHN areas, this percentage ranged from 3.2% in Perth South and Eastern Melbourne to 8.6% in Tasmania. Central and Eastern Sydney, Darling Downs and West Moreton, Northern Sydney, Gold Coast and South Western Sydney had the lowest percentages of adults who delayed or did not see a GP due to cost across the PHN areas, but due to high relative standard error, these data should be interpreted with caution.
- Just over 1 in 20 (6.6%) adults delayed or avoided filling a prescription due to cost in the preceding 12 months. Across PHN areas, this percentage ranged from 4.5% in Eastern Melbourne to 9.3% in the Gold Coast. Northern Sydney had the lowest percentage of adults who delayed or avoided filling a prescription due to cost (3.9%) across the PHN areas, but due to high relative standard error, these data should be interpreted with caution.
Explore patient experiences by PHN
Explore patient experience data in the visualisation below.
Unfortunately due to high relative standard error (RSE) no patient experience data from Western Queensland can be shown. Where an estimate is considered to be unreliable due to a high RSE, it has been removed from publication and will appear white on the map.
'Patient experiences in Australia by small geographic areas, 2013–14 to 2019–20' is an interactive visualisation that includes a geographic map of Australia alongside a horizontal bar chart. Users can filter the visualisation by measure and year. Results are displayed for each PHN in descending order (from highest percentage to lowest percentage) in the horizontal bar chart. Users can highlight a specific PHN, or filter by state/ city to zoom in on a particular part of the map. The map of Australia is broken down by PHN, with PHN colour corresponding to value of the measure. Data used to create this visualisation can be found in the data tables.


