Suicides by service
Suicides by service
The ADF comprises three services: the Royal Australian Navy (Navy), the Australian Army (Army) and the Royal Australian Air Force (Air Force). An individual may move between services over their career. Unless stated otherwise, the service recorded for ex-serving members is their service at their time of separation.
The majority of ex-serving members were in Army (68.4% for males and 62.3% for females). By contrast 16.1% of males and 18.0% of females were in Navy, and 15.5% of males and 19.7% of females were in Air Force.
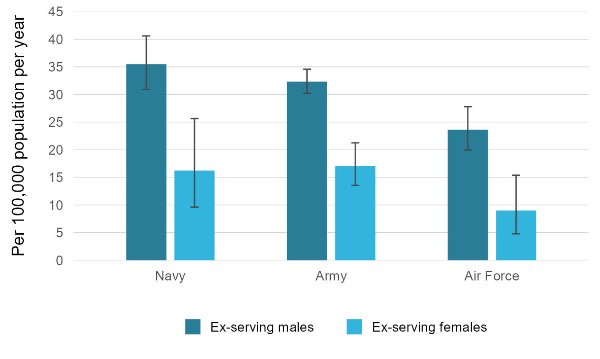
The rate of suicide for ex-serving males from Air Force was lower than for ex-serving from Army or Navy, as shown in Table 6 and Figure 8 below. However, the modelling section suggests that this difference no longer exists when other variables are controlled for (see Figure 18).
| Service |
Ex-serving males: Suicide rate per 100,000 population per year |
Ex-serving females: Suicide rate per 100,000 population per year |
|---|---|---|
| Navy | 35.5 | 16.2 |
| Army | 32.3 | 17.1 |
| Air Force | 23.6 | 9.0 |
Source: AIHW analysis of linked Defence historical personnel data–PMKeyS–NDI data 1985–2020
Figure 8: Suicide rate by service, ex-serving males and females, 1997–2020
Source: AIHW analysis of linked Defence historical personnel data–PMKeyS–NDI data 1985–2020.
Suicide rate by service over time
The following graph (Figure 9) shows how suicide rates for ex-serving males by service vary over time, in 3-year periods from 1997-1999 to 2018-2020. While there is some fluctuation, no statistically significant differences over time were detected. Small numbers mean challenges in detecting statistically significant differences.
Due to small number of suicide deaths among ex-serving females, suicide rates over time are not reported.
Figure 9: Rate of suicide for ex-serving males by service, 1997–1999 to 2018–2020
This time series line graph shows the weighted average suicide rate per 100,000 population per year of ex-serving males by service over time by 3-year periods from 1997 to 1999, to 2018 to 2020.
