Suicides by sex and service status group
Suicides by sex and service status group
Overview
This section presents suicide rates, age-adjusted suicide rates and numbers of deaths by suicide between 1997 and 2020 broken down by the service status groups (permanent, reserve, and ex-serving). While the absolute number of deaths by suicide has increased since the previous report (due to the expansion of the monitoring period to include suicide deaths from 1997) the suicide rates remain similar across both reports, indicating that the overall patterns in suicide risk remain the same.
How do suicide rates vary by service status and sex?
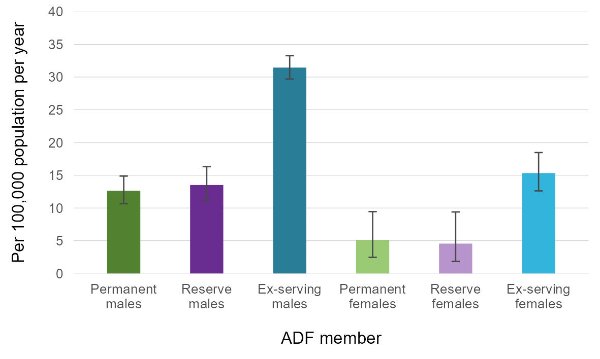
For those with service since 1985, the suicide rate was highest for ex-serving males.
Suicide rates between 1997 and 2020 by service status and sex were as follows:
- 12.6 per 100,000 population per year for permanent males
- 13.5 per 100,000 population per year for reserve males
- 31.4 per 100,000 population per year for ex-serving males
- 5.1 per 100,000 population per year for permanent females
- 4.6 per 100,000 population per year for reserve females
- 15.3 per 100,000 population per year for ex-serving females.
These numbers are given in Figure 1 below. It is important to note that none of these groups are homogeneous (there are likely other underlying factors contributing) and these overall figures are not the full picture. The remainder of this report is dedicated to determining differences between subgroups of serving and ex-serving ADF members.
Figure 1: Suicide rate by service status group and sex, 1997–2020
Note: Due to the difference in age profiles with the Australian population a direct comparison in suicide rates with the ADF population is not appropriate here. A comparison with the general Australian population using SMRs is given in the next section How do suicide rates for permanent, reserve, and ex-serving ADF members compare to the general population?
Source: AIHW analysis of linked Defence historical personnel data–PMKeyS–NDI data 1985–2020.
How many ADF members died by suicide over the study period within each service status group?
Between 1997 and 2020 there were 1,600 certified deaths by suicide among members with ADF service since 1 January 1985. Of these, 1,330 (83%) occurred among ex-serving members, 154 among permanent members, and 115 among reserves. This is presented in Table 1.
| Males | Females | Persons | |
|---|---|---|---|
| Serving | 144 | 10 | 154 |
| Reserve | 108 | 7 | 115 |
| Ex-serving | 1,219 | 111 | 1,330 |
| All ADF members(a) | 1,471 | 128 | 1,600 |
| Australian population(b) | 47,991 | 14,416 | 62,407 |
Notes:
a. For records where year of death was unavailable, records were added to the ‘all ADF members’ total suicide deaths, but are suppressed in other calculations.
b. Number of deaths by suicide from all ADF members are included in the Australian population deaths by suicide count.
Source: AIHW analysis of linked Defence historical personnel data–PMKeyS–NDI data 1985–2020.
AIHW suicide and self-harm monitoring report data 1997–2020.
The number of deaths by suicide for permanent and reserve members combined and ex-serving members by year, is presented in Table 2. For the number of deaths by suicide for males and females by year see Supplementary table S2.3.
When interpreting Table 2, it is important to remember that the ex-serving population increases each year as described in Box 2. As such the increase in ex-serving suicides across the years 1997 to 2020 is not indicative of any increase in suicide rate, which can be seen from the ex-serving male and female time series in Figure 2. (For population sizes by year see supplementary tables S10.2 to S10.4, see Data for a link to the tables.)
| Year | Permanent and reserve | Ex-serving | Total in all ADF service groups(a) |
|---|---|---|---|
| 1997 | 11 | 41 | 52 |
| 1998 | 13 | 55 | 68 |
| 1999 | 7 | 50 | 57 |
| 2000 | 16 | 48 | 64 |
| 2001 | 18 | 47 | 65 |
| 2002 | 14 | 37 | 51 |
| 2003 | 8 | 51 | 59 |
| 2004 | 12 | 44 | 56 |
| 2005 | n.p. | n.p. | 51 |
| 2006(b) | n.p. | n.p. | 42 |
| 2007(c) | 11 | 48 | 59 |
| 2008 | 8 | 50 | 58 |
| 2009 | 13 | 46 | 59 |
| 2010 | 13 | 63 | 76 |
| 2011 | 10 | 62 | 72 |
| 2012 | 7 | 53 | 60 |
| 2013 | 12 | 55 | 67 |
| 2014 | 12 | 68 | 80 |
| 2015 | 10 | 69 | 79 |
| 2016 | 15 | 76 | 91 |
| 2017 | 16 | 70 | 86 |
| 2018 | 6 | 71 | 77 |
| 2019 | 14 | 77 | 91 |
| 2020 | 12 | 67 | 79 |
| Total(d) | 269 | 1,330 | 1,600 |
Notes:
n.p. Not available for publication but included in totals where applicable, unless otherwise indicated. In this case this is a result of low numbers being potentially identifying.
a. Consists of deaths by suicide in males and females for permanent, reserve, and ex-serving ADF members.
b. From 2006 onwards, the ABS implemented a revisions process for coroner-certified deaths (such as suicides). This improved data quality by enabling additional deaths by suicide to be identified beyond initial processing (ABS 2018). For detailed information, see Technical notes.
c. New ABS coding guidelines were applied for deaths registered from 1 January 2007. The new guidelines improve data quality by enabling deaths to be coded as suicide by ABS mortality coders if evidence indicates the death was from intentional self-harm (ABS 2018). For detailed information, see the Technical notes.
d. For records where year of death was unavailable, records were added to the ‘all ADF members’ total suicide deaths, but are suppressed in other calculations.
Source: AIHW analysis of linked Defence historical personnel data–PMKeyS–NDI data 1985–2020.
How do suicide rates for permanent, reserve and ex-serving ADF members compare to the general population?
After adjusting for age differences (using calculated Standardised Mortality Ratios, or SMRs, to control for differences in age distributions between the ADF and Australian populations), permanent and reserve males had a lower rate of suicide than the general Australian population. However, ex-serving males and females had a higher rate of suicide than the general Australian male and female population, respectively.
Compared with the Australian male or female population (whichever is appropriate), suicide rates between 1997 and 2020 were:
- 49% lower for permanent males
- 46% lower for reserve males
- 27% higher for ex-serving males
- 107% (or 2.07 times) higher for ex-serving females.
The differences between the Australian population and both permanent and reserve females were not statistically significant, and so the results do not appear here. Other differences are statistically significant. While the 107% figure for ex-serving females is larger than the 27% figure for ex-serving males, it should be noted that these are both a comparison with the general Australian population. The crude rate for ex-serving females is significantly lower than it is for ex-serving males (as shown in Figure 1).
It is important to note that these groups are not homogeneous. There are other underlying factors which are explored throughout the rest of this report.
Unlike suicide rates, these SMRs cannot be used to compare suicide rates between service groups or across time. This is because each SMR is a measure that provides a comparison that is specific to the two populations involved, see the Technical notes for further detail.
How have suicide rates changed over time for the different service status groups?
This section presents suicide rates over time, in 3-year periods. Due to small numbers there is some variability in these rates. Over the study period:
- The suicide rate for permanent males remained relatively constant, ranging between 13.9 deaths per 100,000 population per year in 1997–1999 and 10.3 in 2018–2020.
- The suicide rate for males in the reserves remained relatively constant, allowing for the confidence interval, ranging between 8.4 deaths per 100,000 population per year in 2003–2005 and 15.3 in 2018–2020.
- The suicide rate for ex-serving males remained relatively constant, ranging between 25.8 per 100,000 population in 2005–2007 and 30.4 in 2018–2020. There was an overall drop in the rate of suicide from the late 1990s to the mid 2000s, which is consistent with the pattern observed in Australian males over the same period.
- The suicide rate for ex-serving females has fluctuated between 7.5 deaths per 100,000 population per year in 2003–2005 and 23.4 in 2015–2017. There is no easily identifiable trend, and there are large confidence intervals around these rates throughout due to the low total numbers.
The rates of suicide for males and females for the Australian general population are presented in the final two graphs of this section (Figures 2 and 3) for comparison.
The interactive graph below presents the suicide rates for males in each of the three ADF service status groups and ex-serving females, for all 3-year periods from 1997-1999 to 2018-2020.
Figure 2: Rate of suicide by service status and sex, 1997–1999 to 2018–2020
This time series line graph shows the weighted average suicide rate per 100,000 population per year by service status and sex over time by 3-year periods from 1997 to 1999, to 2018 to 2020.

This time series line graph shows the weighted average suicide rate per 100,000 population per year by service status and sex over time by year from 1997 to 2020.

Data underlying this graph are available in Supplementary tables S3.2, S5.2 and S6.1. See Data for a link to the tables.
Please note, data for more recent years are subject to change: see the Technical notes for further detail.
How do suicide rates compare between ex-serving members with permanent service and reserve service?
Ex-serving ADF members can have either served in the permanent or reserve forces, or a combination of both over their ADF service career. The level of service duties and obligations vary greatly between the two, with permanent forces expected to render higher levels of service than reserves1. This section explores suicide rates for the ex-serving cohorts.
In this section, ex-serving members who were at any time engaged in permanent service will be considered ‘permanent ex-serving’, even if they were engaged in reserve service before fully separating. By contrast, those who joined and served solely in a reserve capacity will be considered ‘reserve ex-serving’. This distinction will not be kept throughout the report.
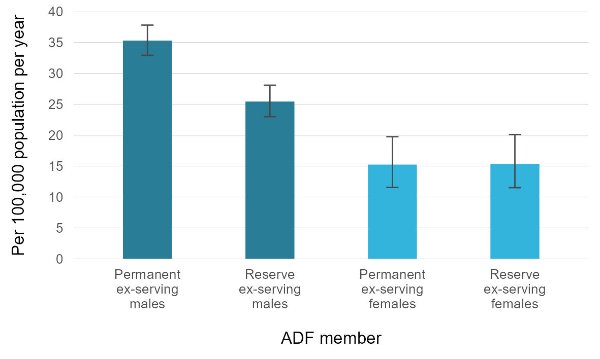
Between 1997 and 2020 the suicide rates for the ex-serving cohort were:
- 35.3 per 100,000 population per year for permanent ex-serving males
- 25.4 per 100,000 population per year for reserve ex-serving males
- 15.2 per 100,000 population per year for permanent ex-serving females
- 15.4 per 100,000 population per year for reserve ex-serving females.
These values are shows in the Figure 4 below.
Figure 4: Suicide rates for permanent ex-serving and reserve ex-serving, males and females, 1997–2020
Source: AIHW analysis of linked Defence historical personnel data–PMKeyS–NDI data 1985–2020.
This figure demonstrates that there is a higher suicide rate among permanent ex-serving males compared with reserve ex-serving males. It should be noted that most involuntary medical separations come from the permanent ex-serving cohort, which may explain this difference in rates (see the Suicides by reason for separation section). There was no corresponding statistically significant difference among the female cohorts.
Further exploring the interaction between permanent service and involuntary medical separation is a potential inclusion for future reports.
Data underlying this section are available in supplementary tables S3.1, S4.1, and S4.2. See Data for a link to the tables.
- From 2016 Defence introduced the ADF Total Workforce System which outlines the spectrum of service categories and service options that cover the range of service duties and obligations across ADF serving personnel. Since this categorisation has only been in use since 2016 it is not used in this analysis.
If you need help or support, please contact:
- Open Arms - Veterans and Families Counselling 1800 011 046
- Open Arms Suicide Intervention page
- Defence All-hours Support Line (ASL) 1800 628 036
- Defence Member and Family Helpline 1800 624 608
- Defence Chaplaincy Support 1300 333 362
- ADF Mental Health Services
- Lifeline 13 11 14
- Suicide Call Back Service 1300 659 467
- Beyond Blue Support Service 1300 22 4636
For information on support provided by DVA, see: