Numbers and rates of young people under supervision
National
On an average day in 2022–23, 4,542 young people aged 10 and over were under youth justice supervision in Australia (Figure 2.1; Table 2.1). A total of 9,157 young people were supervised at some time during the year (Table S1b).
On an average day, most young people aged 10 and over who were under supervision were supervised in the community (82%); the remainder (18%) were in detention (tables S1a, S34a and S72a).
Although relatively few young people were in detention on an average day, about half (50%, or 4,605) of all young people who were supervised during 2022–23 had been in detention at some time during the year (Figure 2.1). A high proportion of young people who were supervised during 2022–23 had also been under community-based supervision at some point during the year (87%, or 7,934). The high proportions of young people under community-based supervision and detention during the year indicates that young people often experience both community-based supervision and detention during the year (Figure 2.1).
As well, the difference between the number in detention on an average day and the number who had been in detention during the indicates that most young people typically spend a short time in detention (see Appendix A).
Figure 2.1: Young people under supervision on an average day and during the year, by supervision type, 2022–23 (number and rate)
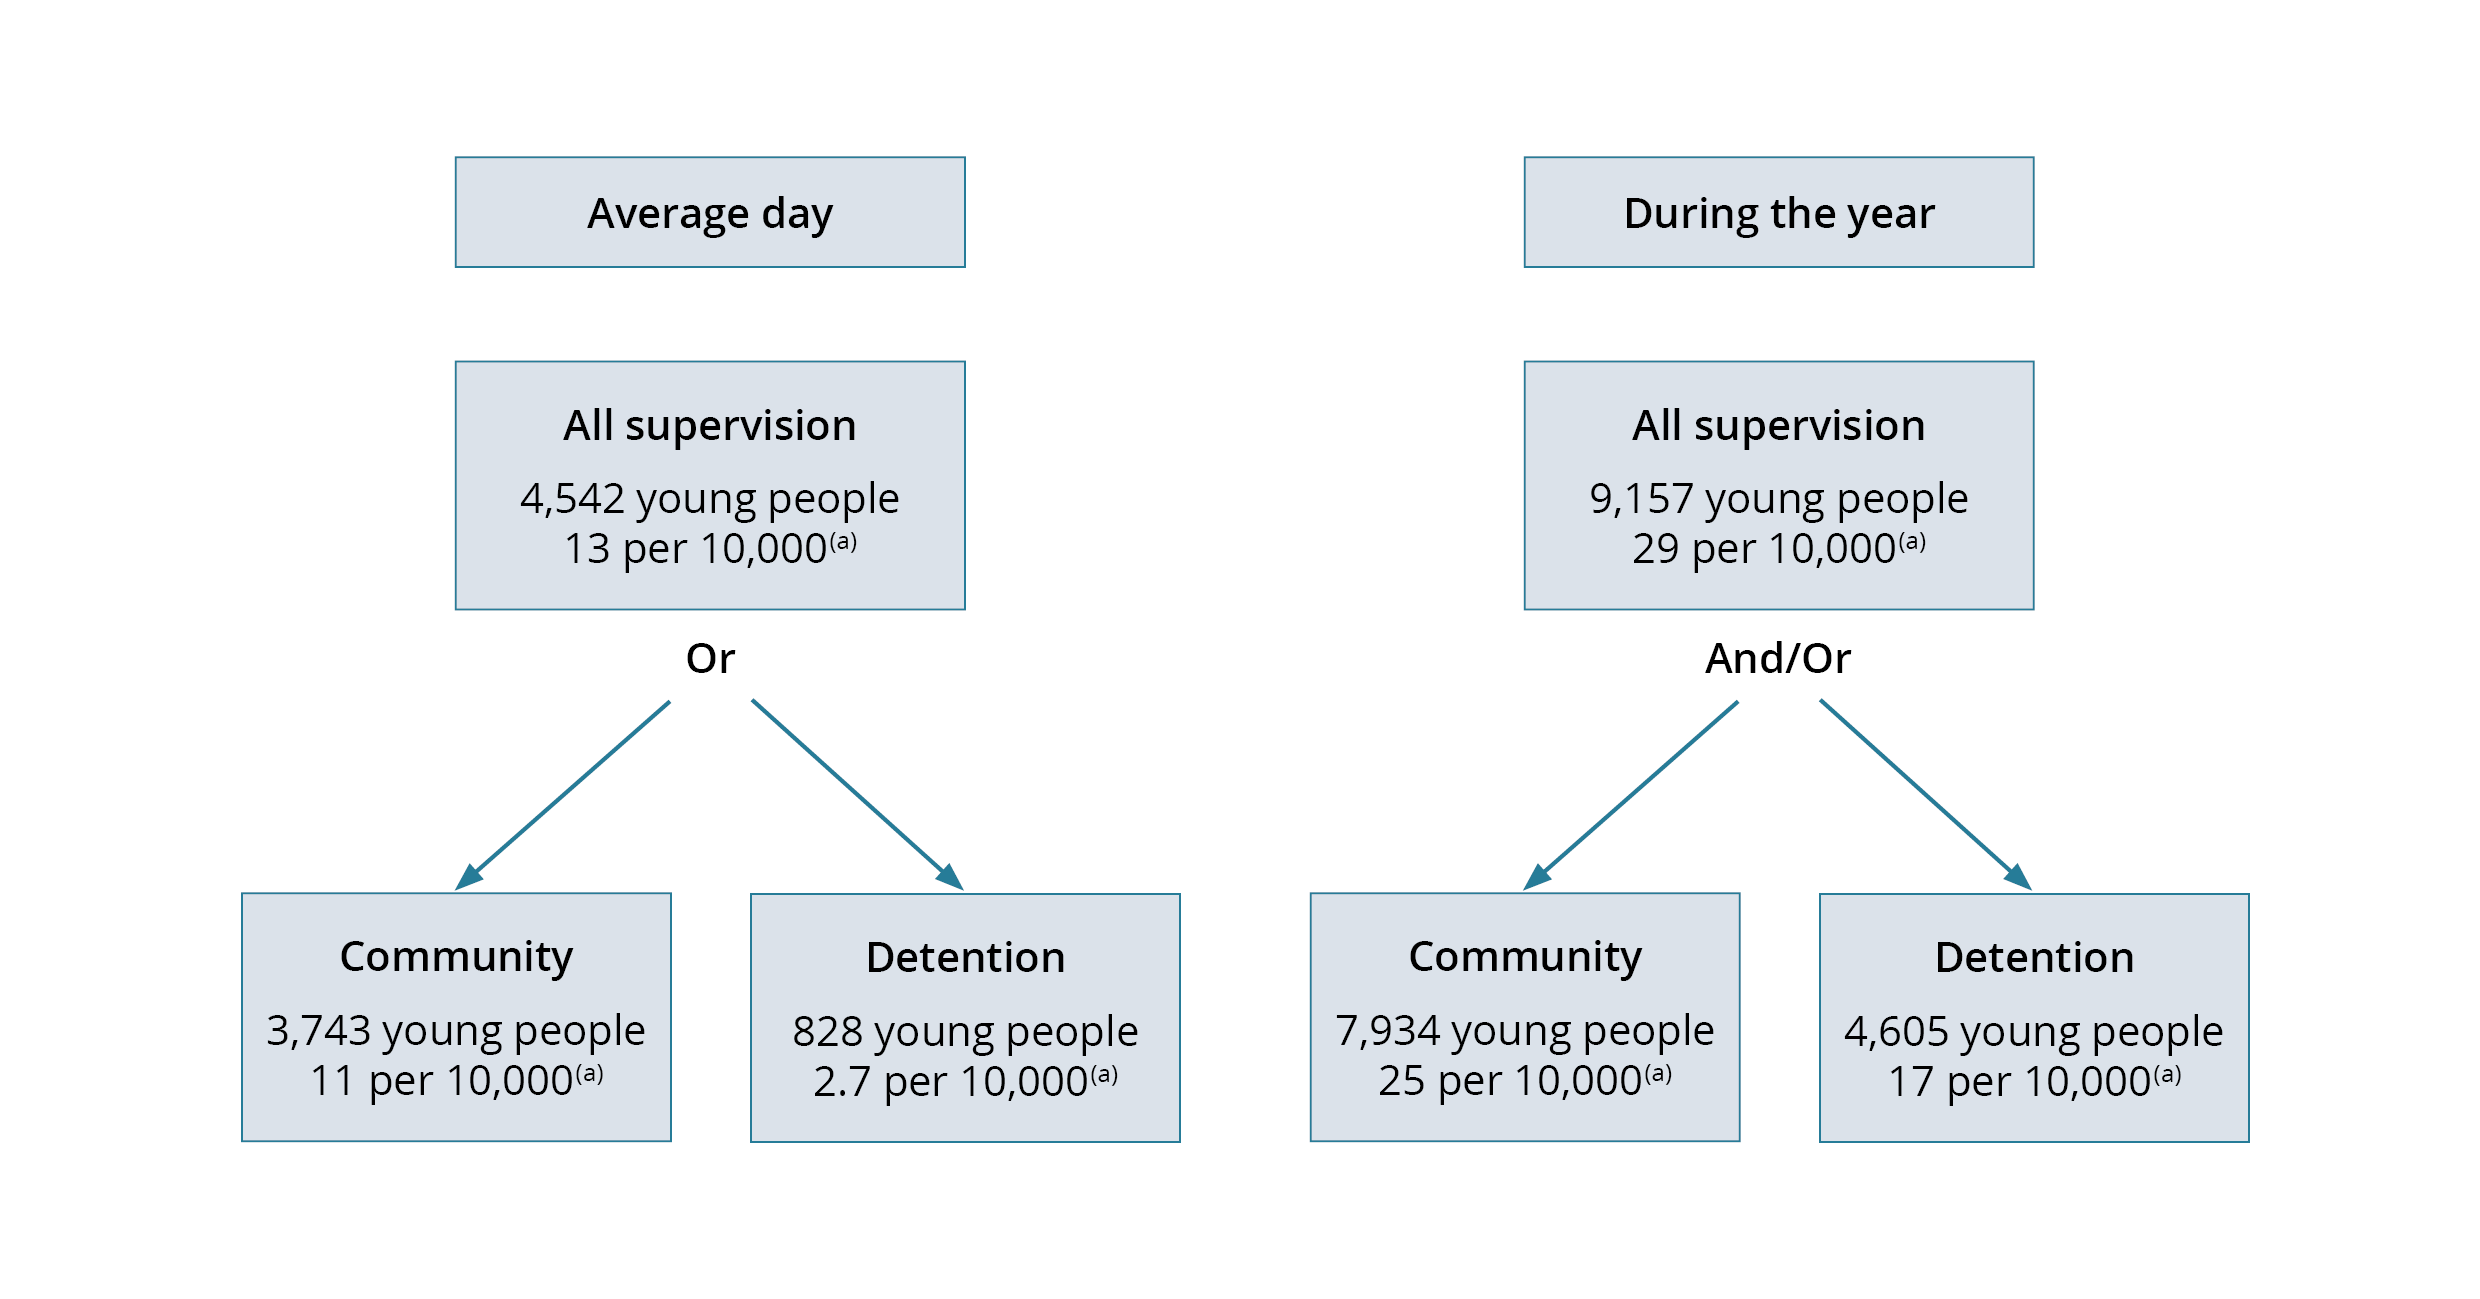 Rates are presented for young people aged 10–17.
Notes
- The average daily number of all supervision will not equal the sum of community-based supervision and detention because young people can be in both types of supervision on the same day.
- Young people can be in both community-based supervision and detention during the year so the sum of these types of supervision will not be equal to the total number of young people under youth justice supervision.
Sources: tables S1a, S1b, S4a, S4b, S34a, S34b, S37a, S37b, S72a, S72b, S75a and S75b.
The rate of young people aged 10–17 under youth justice supervision on an average day was about 13 per 10,000 (Figure 2.1).
On an average day, the rate of young people aged 10–17 under community-based supervision was 11 per 10,000 and the rate for those in detention was 2.7 per 10,000 (Table 2.1).
Table 2.1: Young people under supervision, by supervision type and state and territory, 2022–23
Type of supervision | NSW | Vic | Qld | WA | SA | Tas | ACT | NT | Australia |
|---|---|---|---|---|---|---|---|---|---|
Average day(a) | 806.5 | 491.0 | 1,295.0 | 528.2 | 230.3 | 95.4 | 39.7 | 256.5 | 3,742.6 |
Average day(a) | 199.8 | 108.1 | 310.1 | 98.7 | 27.0 | 13.6 | 18.7 | 52.2 | 828.1 |
Average day(a) | 1,001.2 | 595.9 | 1,595.3 | 622.1 | 254.9 | 108.6 | 57.8 | 306.1 | 4,542.0 |
During the year: | 1,741 | 1,101 | 2,474 | 1,296 | 539 | 184 | 107 | 492 | 7,934 |
During the year: | 1,489 | 441 | 1,101 | 809 | 323 | 58 | 109 | 275 | 4,605 |
During the year: | 2,443 | 1,153 | 2,567 | 1,527 | 602 | 199 | 155 | 511 | 9,157 |
| Type of supervision | NSW | Vic | Qld | WA | SA | Tas | ACT | NT | Australia |
|---|---|---|---|---|---|---|---|---|---|
Average day(a) | 9.1 | 3.7 | 15.8 | 15.7 | 10.9 | 12.4 | 8.2 | 61.2 | 10.6 |
Average day(a) | 2.0 | 1.1 | 5.0 | 3.0 | 1.5 | 2.4 | 3.4 | 19.2 | 2.7 |
Average day(a) | 11.0 | 4.7 | 20.7 | 18.6 | 12.2 | 14.7 | 11.5 | 79.5 | 13.3 |
During the year: | 20.5 | 9.1 | 34.5 | 42.3 | 27.1 | 26.7 | 24.8 | 142.4 | 25.0 |
During the year: | 17.3 | 5.7 | 18.9 | 27.9 | 18.1 | 10.8 | 25.2 | 102.4 | 16.9 |
During the year: | 28.3 | 9.8 | 36.2 | 50.4 | 30.6 | 29.5 | 33.8 | 151.0 | 29.4 |
- Numbers of young people on an average day might not sum to the total due to rounding, and because some young people might have moved between community-based supervision and detention on the same day.
Notes
- Numbers of young people on an average day represent all young people aged 10 and over under youth justice supervision. This includes some young people aged 18 and over. Rates are age specific and are calculated for young people aged 10–17 as this is the core age group of the youth justice population.
- See Appendix A for more information about ‘average day’ and ‘during the year’ measures.
- Age on an average day is calculated based on the age a young person is each day that they are under supervision. If the age of a young person changes during a period of supervision, the average daily number under supervision will reflect this. Average daily data broken down by age will not be comparable with data in Youth justice in Australia releases before 2019–20.
Sources: tables S1, S4, S34, S37, S72 and S75
States and territories
The size of youth justice populations in states and territories can be impacted by the population size of the jurisdiction, as well as by differences in state-based legislation, policies and practices, including the available types of supervised orders and options for diversion.
Among the states and territories, Queensland and New South Wales accounted for more than half of all young people under supervision on an average day, regardless of supervision type.
Young people in Queensland made up:
- 35% of all young people under supervision
- 35% of all young people under community-based supervision
- 37% of all young people under detention (Table 2.1).
Young people in New South Wales made up:
- 22% of all young people under supervision
- 22% of all young people under community-based supervision
- 24% of all young people under detention (Figure 2.2; Table S1a).
Figure 2.2: Young people under supervision on an average day, by supervision type and State or territory, 2022–23 (number)
This horizontal bar chart shows the number of young people under community-based supervision and in detention in each state and territory. It shows that Queensland and New South Wales had the highest numbers of young people under community-based supervision and detention.

This figure contains three vertical bar charts displaying rates of young people under youth justice supervision, community-based supervision and detention. While most states vary by supervision type, the Northern Territory had the highest rates and Victoria the lowest across all supervision types.
