Completion of treatment
Reasons for clients no longer receiving treatment from an AOD treatment service include:
- expected completions (for example, treatment program completed)
- unplanned completions (for example, the client ceased to participate in the treatment program without notice)
- administrative completion (for example, client transferred to another service provider) (see Key terminology and glossary).
In 2021–22:
- treatment episodes for a client’s own alcohol or drug use:
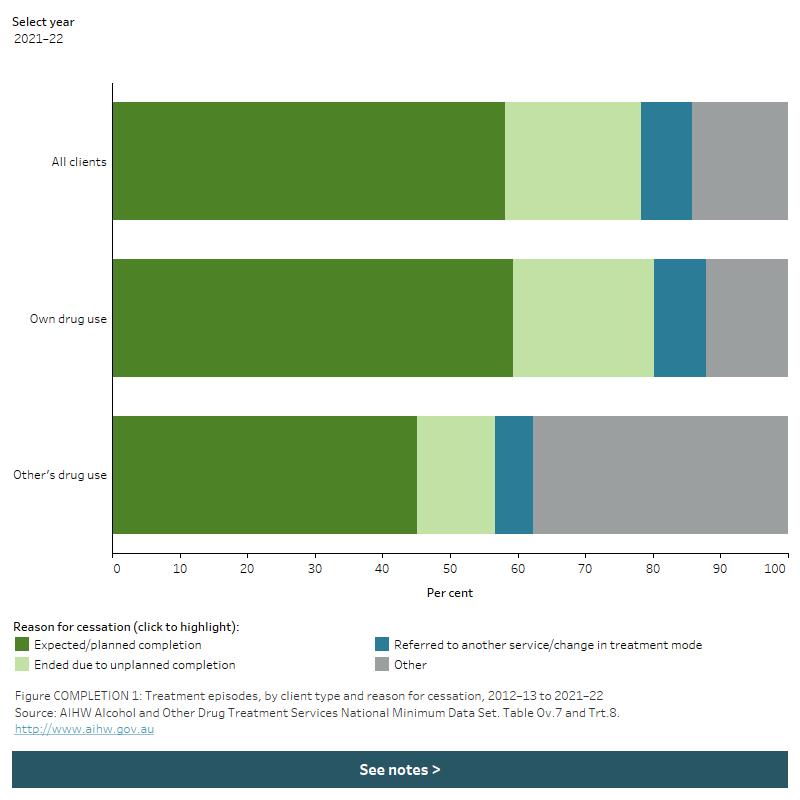
- almost 3 in 5 (58%) treatment episodes ended as expected (planned) completions
- around 1 in 5 (20%) of treatment episodes ended due to an unplanned completion (Table Trt.8).
- This pattern differed slightly for clients who received support for someone else’s alcohol or drug use; the proportion of treatment episodes that ended due to unplanned completion was lower (12%) than for a client’s own alcohol or drug use (Figure COMPLETION 1, Table Trt.8).
Figure COMPLETION 1: Treatment episodes, by client type and reason for cessation, 2012–13 to 2021–22
The stacked horizontal bar graph shows that most treatment episodes in 2021–22 ended with an expected/planned completion, regardless of client type. Treatment episodes provided to clients for their own drug use were more likely to end with an expected completion than were episodes provided to clients for someone else’s drug use 59.3% compared with 45.1%, respectively). 37.8% of episodes provided to clients for other’s drug use ended for other reasons, compared to 12.1% of episodes for clients’ own drug use. A filter allows the user to view data for different years.

In 2021–22, completion of treatment for a client’s own alcohol or drug use varied by principal drug of concern. For example, treatment episodes for:
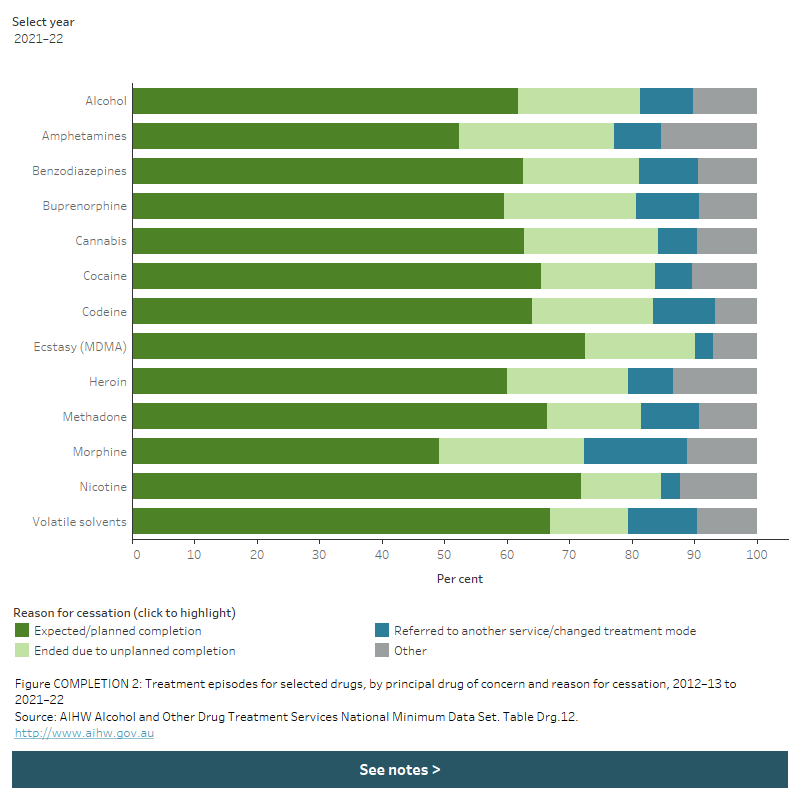
- the most common principal drugs of concern had expected completion proportion ranging from 63% for cannabis to 52% for amphetamines
- ecstasy (73%) and nicotine (72%) as the principal drugs of concern had the highest proportion of episodes ending with an expected completion
-
other stimulants and hallucinogens had the highest proportion of episodes for unplanned completions (26%), followed by amphetamines (25%), oxycodone (24%) and morphine (23%) (Table Drg.14, Figure COMPLETION 2).
Figure COMPLETION 2: Treatment episodes for selected drugs, by principal drug of concern and reason for cessation, completion, 2014–15 to 2021–22
The stacked horizontal bar chart shows that expected/planned completion was the most common reason for cessation in treatment episodes for all selected principal drugs of concern in 2021–22. The proportion of episodes that ended with an expected completion ranged from 49.1% for morphine as the principal drug of concern to 72.5% for ecstasy (MDMA). A filter allows the user to view data for different years.

Over the 10 years to 2021–22, for a client’s own alcohol or drug use, the proportion of treatment episodes that ended in an expected completion decreased overall, falling by 4 percentage points to 59% (Table Ov.7):
- where alcohol was the principal drug of concern, around 3 in 5 episodes ended with an expected completion (ranging from 62% to 66% between 2012–13 and 2021–22)
- where amphetamines were the principal drug of concern, the proportion of treatment episodes with an expected completion decreased 62% in 2015–16 to 52% in 2021–22
- where cannabis was the principal drug of concern, the proportion of treatment episodes with an expected completion decreased from 73% in 2016–17 to 63% in 2021–22
- where heroin was the principal drug of concern, the proportion of treatment episodes with an expected completion ranged between 53% and 61% between 2012–13 and 2021–22 (Table Drg.12).
Over the 10 years to 2021–22, for someone else’s alcohol or drug use:
- the proportion of treatment episodes with an expected completion fell from 75% in 2012–13 to 45% in 2021–22
- conversely, ‘other’ as a reason for ceasing treatment increased from 11% in 2012–13 to 38% in 2021–22 (Table Ov.7).


