Alcohol has remained the most common principal drug of concern (PDOC) since the beginning of reporting for the Alcohol and Other Drug Treatment Services National Minimum Data Set (AODTS NMDS) in 2002–03.
In 2024–25, of the 214,662 treatment episodes provided for a client’s own drug use, alcohol was reported as a drug of concern (either principal or additional) in half of all treatment episodes (48% or 102,923) (Table Drg.5).
In 2024–25:
- Alcohol remained the most common principal drug of concern (41%, 87,632 episodes) (Table Drg.5).
- 24% (21,160) of alcohol-related treatment episodes reported at least one additional drug of concern (Table Drg.2). The most common additional drugs of concern were:
- cannabis (35%, 10,706)
- nicotine (29%, 8,744) (Table Drg.3).
- The proportion of treatment episodes for alcohol in relation to all other drugs of concern rose from 32% in 2015–16 to 41% in 2024–25 (Table Drg.1).
Clients can nominate up to 5 additional drugs of concern, these drugs may not have been the subject of any treatment in the episode.
Figure ALCOHOL: Closed treatment episodes for own alcohol or drug use by alcohol as a principal drug of concern and top 5 additional drugs of concern, 2024–25
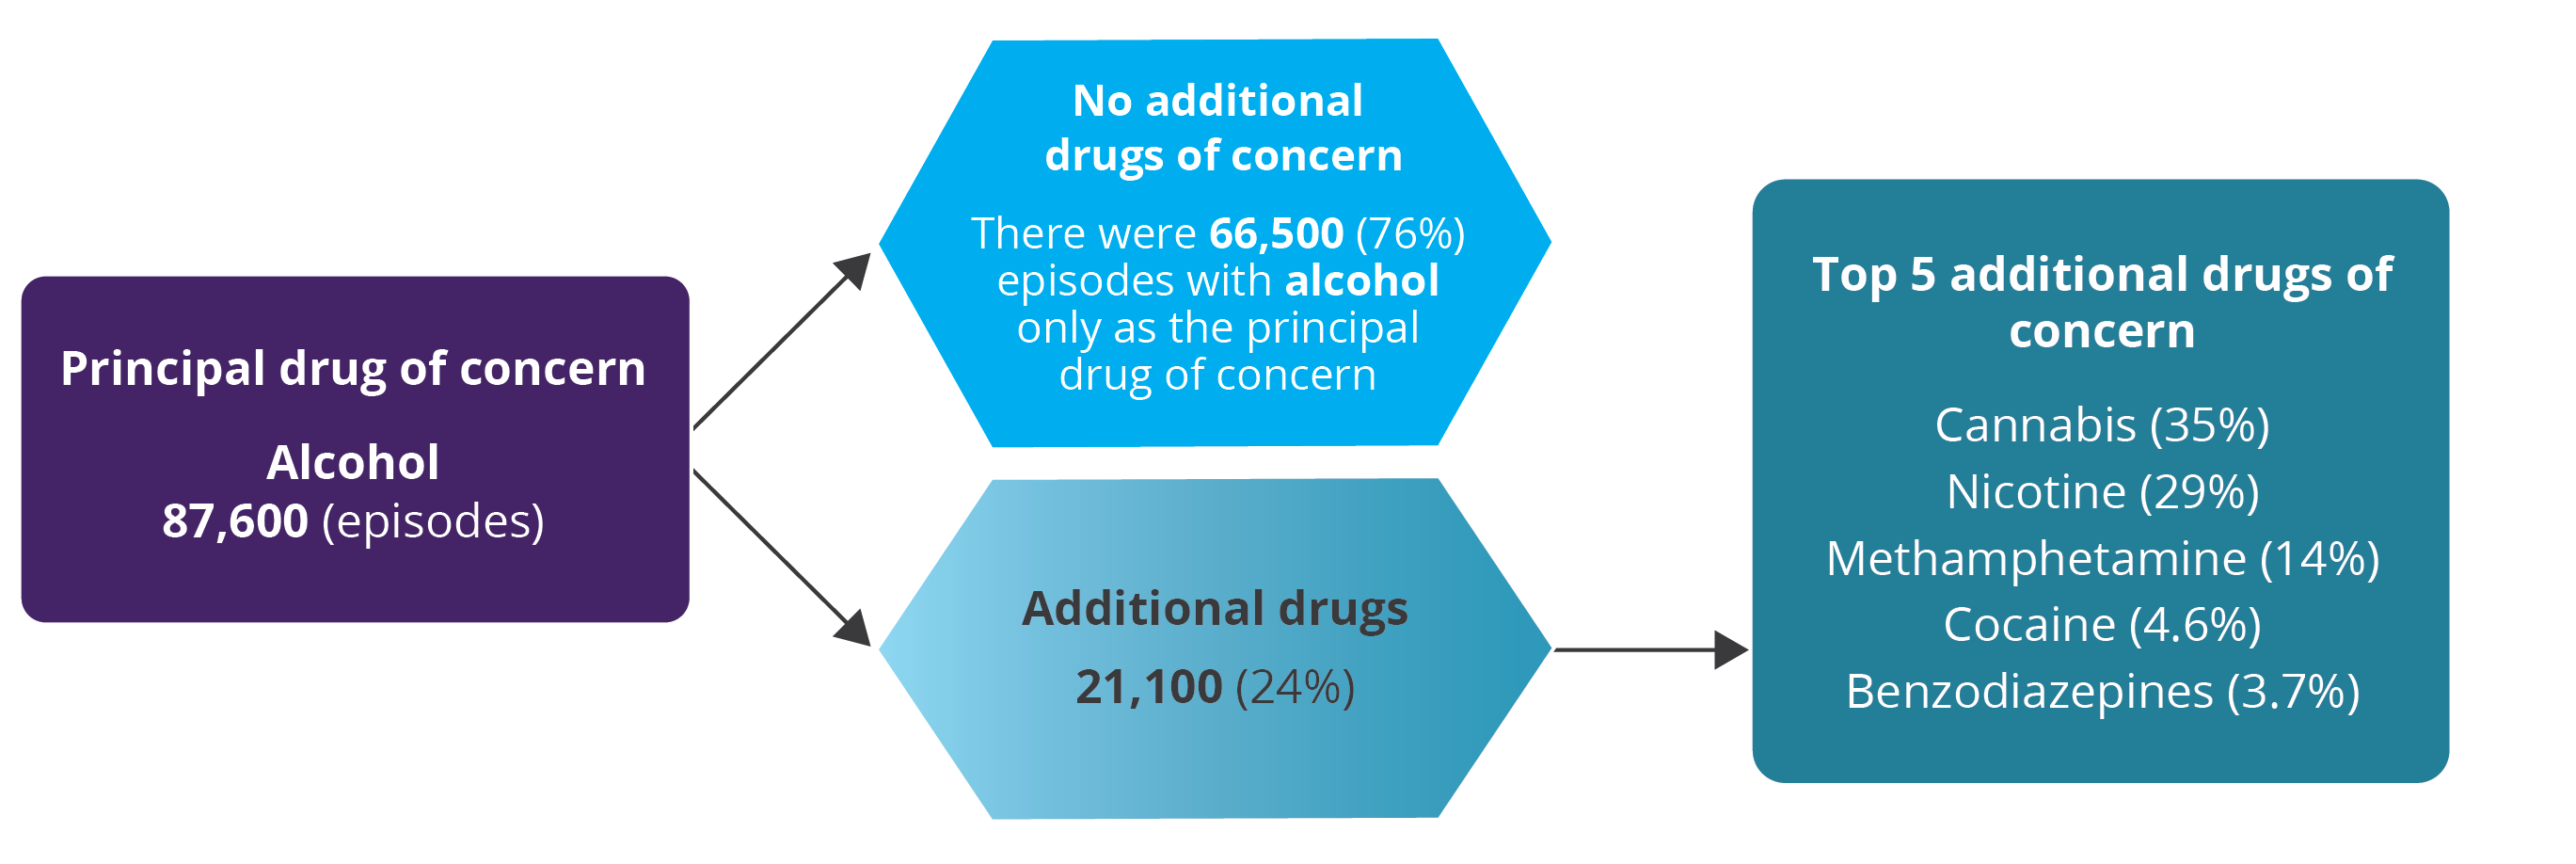
Note: Diagram presents the top 5 additional drugs of concern for a principal drug of concern by closed treatment episodes. Totals do not add to 100%.
Figure 1: Clients with alcohol as the principal drug of concern, by sex and age group, 2024–25
Butterfly chart shows the disaggregation of male and female clients receiving treatment for alcohol as the principal drug of concern by age group in 2024–25.

Figure 2: Treatment episodes with alcohol as the principal drug of concern, by main treatment type, reason for cessation or source of referral, 2015–16 to 2024–25
Line graph shows the number of episodes with alcohol as the principal drug of concern for main treatment type, reason for cessation, and source of referral in 2015–16 to 2024–25. Data is filtered by episodes and per cent.
