Methamphetamine: client demographics and treatment

In 2024–25, of the 214,662 treatment episodes provided for a client’s own drug use, methamphetamine was reported as a drug of concern (either principal or additional) in 3 in 10 treatment episodes (29%, 62,549) (Table Drg.5).

In 2024–25:

  • Methamphetamine was the second most common principal drug of concern (24%, 50,863 episodes) (Table Drg.4).
    • This has been the case since 2022–23, when methamphetamine surpassed cannabis as the second most common principal drug of concern (Table Drg.5).
  • Methamphetamine treatment episode increases since 2019–20 (from 47,599 to 50,863 in 2024–25), are due to improvements in methamphetamine data reliability and greater consistency in reporting (Figure 3).
  • 4 in 10 (38%, 19,551) methamphetamine treatment episodes reported at least one additional drug of concern (Table Drg.2). For methamphetamine, the most common additional drugs of concern were:
    • Cannabis (31%, 10,443)
    • Alcohol (20%, 6,711)
    • Nicotine (18%, 5,953) (Table Drg.3).

Clients can nominate up to 5 additional drugs of concern: these drugs may not have been the subject of any treatment in the episode.    

Figure METHAMPHETAMINE: Closed treatment episodes for own alcohol or drug use by amphetamines as a principal drug of concern and top 5 additional drugs of concern, 2024–25

The flow chart shows methamphetamine as a principal drug of concern broken down by additional drugs of concern in 2024–25.

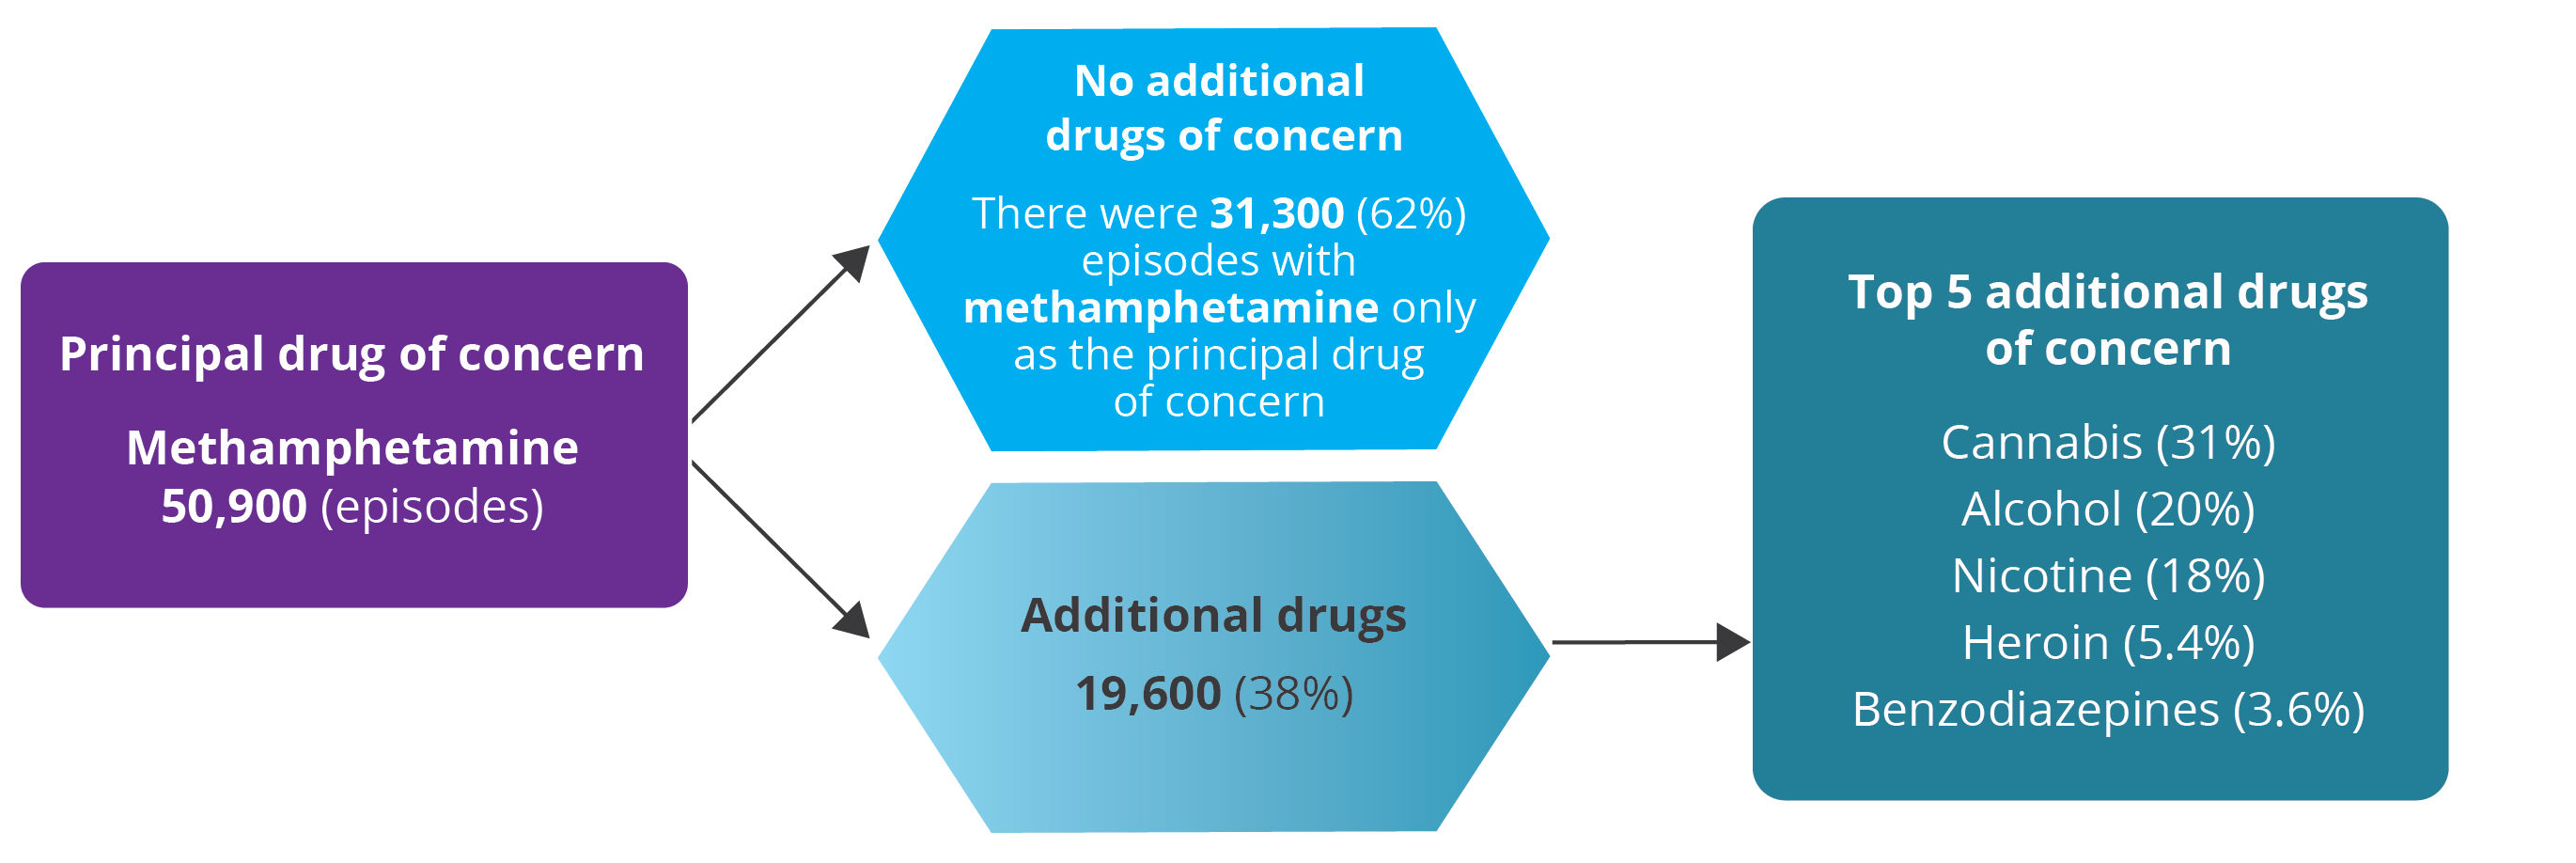
Note: Diagram presents the top 5 additional drugs of concern for a principal drug of concern by closed treatment episodes. Totals do not add to 100%.

Client demographics

In 2024–25, 26,831 clients received treatment for methamphetamine as the principal drug of concern.

Of these clients:

  • 3 in 5 were male (63%) (Table SC.9).
  • 2 in 3 people were aged either 30–39 years (38%) or 40–49 years (27%) (Table SC.10).
    • This was consistent for both males and females (Figure 2).
  • 1 in 5 people were Aboriginal and Torres Strait Islander (First Nations) people (23%) (Table SC.11).
    • This represents a rate of 902 First Nations clients per 100,000 people (crude rate for clients aged 10 and over) (Table SCR.26).

Figure 1: Clients with methamphetamine as the principal drug of concern, by sex and age group, 2024–25

Butterfly chart shows the disaggregation of male and female clients receiving treatment for methamphetamine as the principal drug of concern by age group in 2024–25.

Butterfly chart shows the disaggregation of male and female clients receiving treatment for methamphetamine as the principal drug of concern by age group in 2024–25.

Treatment

In 2024–25, 50,863 treatment episodes were provided to clients for methamphetamine as the principal drug of concern (Table Drg.4).

Among these episodes:

  • The most common referrals into treatment were from self or family (36%, 18,271), and health services (28%, 14,235) (Table Drg.37) (Figure 2, Table Drg.13).
  • The most common main treatment types were counselling (35%, 17,911) and assessment only(23%, 11,654) (Figure 2, Table Drg.36).
    • This is consistent with previous years, although the proportion of counselling episodes has fluctuated in the 10 years to 2024–25.
  • The most common treatment settings were non-residential treatment settings (65%) and residential treatment settings (17%) (Table Drg.38).
  • The median duration of methamphetamine treatment episodes was around four weeks (29 days) (Table Drg.39).
    • Episode duration varied by main treatment type, with the longest median duration being around 9 weeks (64 days) for counselling (Table Drg.41).
    • 1 in 3 (30%) treatment episodes lasted 2–29 days, and a further 1 in 4 (27%) lasted 1 to 3 months (Table OV.12).
  • The most common reasons methamphetamine-related AOD treatment ended were planned completion (51%) and unplanned completion (25%) (Figure 3, Table Drg.38).

Figure 2: Treatment episodes with amphetamine-related drugs as the principal drug of concern, by main treatment type, reason for cessation or source of referral, 2015–16 to 2024–25

Line graph shows the number of episodes with amphetamines as the principal drug of concern for main treatment type, reason for cessation, and source of referral from 2015–16 to 2024–25. Data is filtered by episodes and per cent.

Line graph shows the number of episodes with amphetamines as the principal drug of concern for main treatment type, reason for cessation, and source of referral from 2015–16 to 2024–25. Data is filtered by episodes and per cent.

Method of use

In 2024–25, among methamphetamine treatment episodes (50,863), the most common methods of use were:

  • Smoking/inhaling (51%)
  • Injecting (32%) (Figure 4, Table Drg.6).

Between 2019–20 and 2024–25, as data reliability improved:

  • Among methamphetamine treatment episodes, where the method of use was smoking/inhaling rose from 24,809 in 2019–20 to 27,324 in 2024–25.
  • Among amphetamine-related episodes, where the method of use was smoking/inhaling dropped in 2019–20 (4,699 episodes) to 2,194 in 2024–25 (Figure 4, Table Drg.6).
  • Among methamphetamine episodes, with injecting as a method of use peaked in 2019–20 (18,497), fluctuating until 2024–25 (16,298).
  • Among amphetamine-related episodes with injecting as a method of use fell in 2019–20 (6,357 episodes) to 3,838 episodes in 2024–25 (Figure 4, Table Drg.6).

Figure 3: Treatment episodes with amphetamine-related drugs as the principal drug of concern, by amphetamine type and method of use, 2015–16 to 2024–25

Line graph shows the number of episodes with amphetamines type and method of use drugs as the principal drug of concern in 2015–16 to 2024–25. Data is filtered by measure and amphetamine type.

Line graph shows the number of episodes with amphetamines type and method of use drugs as the principal drug of concern in 2015–16 to 2024–25. Data is filtered by measure and amphetamine type.