Natural environment and health
Web article
Release Date:
Section: Determinants of health
Citation
AIHW (Australian Institute of Health and Welfare) (2026) Natural environment and health, AIHW, Australian Government, accessed 28 July 2026.

The natural environment comprises the atmosphere, land, water, oceans, and the diversity of living things (UN 2019). It provides essential resources for health and wellbeing, including air, food, fresh water, wood and fibre, fuel and medicines. It also helps regulate weather, vegetation, soils, and the quality of water and air, and provides a range of aesthetic, cultural, recreational and spiritual services to people (Whitmee et al. 2015).
This page presents a selection of evidence on the influence of the natural environment on human physical and mental health in Australia. This includes reporting positive impacts of the natural environment on health. It also includes identifying hazards from the natural environment, which are changing due to climate change, and associated health impacts. There is increasing research to estimate environmental health impacts, and potential risks in the future, which can assist with policy development and climate risk-related planning, adaptation and mitigation.
The natural environment is a determinant of health due to its ability to affect health outcomes (see What are determinants of health?). For more information on the health impacts of human-made surroundings, see Built environment and health.
Connection to Country
Aboriginal and Torres Strait Islander (First Nations) people have had a continuous, ongoing and strong connection with the Australian environment for tens of thousands of years. A range of cultural factors contribute to First Nations people’s health and wellbeing, including the fundamentally important concepts of connection to Country and caring for Country (Bourke et al. 2018; Redvers et al. 2020). While there are challenges in measuring the influence of cultural factors on health and wellbeing, and the field of research is emerging, the majority of studies have found a positive effect of cultural factors on health and wellbeing of First Nations people (Bourke et al. 2018; MacLean et al. 2017).
Caution: This content contains information some readers may find distressing. For a list of support services visit crisis and support services.
Climate change and health
What is climate change?
As a result of human activity, the health of most or all the planetary systems that provide human health services is currently in decline, including some systems facing a growing likelihood of crossing irreversible tipping points, with major consequences for earth systems (UN 2019; UN 2025).
Climate change refers to a change in the pattern of weather (the state of the atmosphere: temperature, rainfall, and so on) and relatedly, changes in oceans, land surfaces and ice sheets, occurring over decades or longer (Australian Academy of Science 2019). Human activities associated with a range of sectors – such as energy supply, industry, agriculture, forestry and transport – contribute to atmospheric greenhouse gas concentrations. Greenhouse gases trap heat in the atmosphere, which heats the land and oceans and changes weather patterns, including increasing the likelihood of extreme events (IPCC 2021) (see Figure 1). There is a growing likelihood of crossing irreversible tipping points relating to shifts in ocean circulation, ice sheet loss, forest die-back and coral reef ecosystem collapse, with significant consequences for earth systems (UN 2025). The evidence of human influence on global warming is considered unequivocal (IPCC 2021).
Globally:
- the average annual temperature in 2025 was estimated to be around 1.43ºC above the pre-industrial (1850–1900) average
- the 11 years from 2015 to 2025 were the 11 warmest years in the 176-year observational record
- concentrations of greenhouse gases (such as carbon dioxide) continue to increase
- ocean warming, sea-level rise, and deep ocean acidification will remain irreversible for hundreds of years (WMO 2026a, 2026b).
Climate change and its impacts are experienced differently in different places (ACS 2025b) but Australia’s land surface has warmed by an average of 1.59ºC, between 1910 and 2025, and our oceans by an average of 1.16ºC between 1900 and 2025 (Bureau of Meteorology 2026a).
When averaged over the years 2010 to 2019, Australia’s largest source of carbon dioxide was emissions associated with the extraction and use of coal (179 megatonnes per year (Mt/year)), followed by oil (136 Mt/year), gas (84 Mt/year) and logging, crops and livestock (60 Mt/year). Substantial emissions are also embedded in fossil fuel exports (1055 Mt/year) (Bureau of Meteorology and CSIRO 2024).
Figure 1: Predicted changes in hazards for Australia
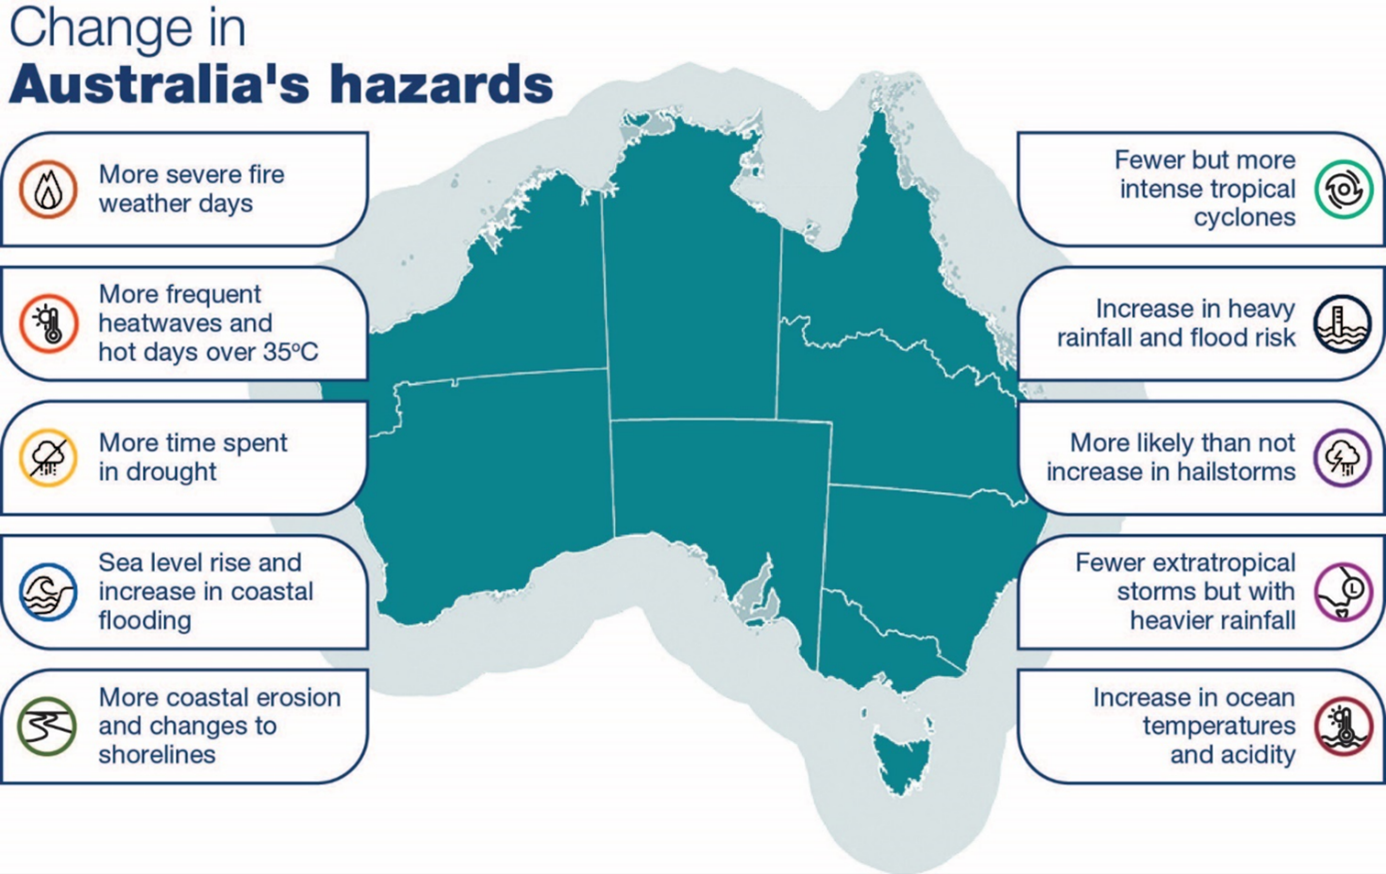
Figure © Commonwealth of Australia (Department of Health and Aged Care) 2023
Impacts of climate change on health and wellbeing
Climate change affects environmental determinants of human health through a range of pathways, from the frequency of extreme weather events to the prevalence of infectious and communicable diseases, to the availability of safe air, water and food (ACS 2025b; Ebi et al. 2018; WMO 2026b). This can result in health-related impacts such as thermal stress, injury, increases in vector-borne and other infectious diseases, food insecurity and poor mental health (Hickman et al. 2021; McMichael et al. 2006). The social determinants of health are also being affected by climate change (WHO 2023). Meanwhile, mitigation efforts can bring health benefits (Melbourne Climate Futures 2026).
Climate change affects some population groups more than others. Groups at greater risk include older people, children, pregnant women, people with chronic conditions and multimorbidity, outdoor workers, people living in rural and remote areas, those living in low-lying, flood- or bushfire-prone areas, socioeconomically disadvantaged groups and people with disability (ACS 2025b; Gaskin et al 2017; IPCC 2022). Individuals and households can fall into multiple higher-risk groups.
Climate change is also likely to affect First Nations people to a greater extent than non-Indigenous populations (Beggs et al. 2021; HEAL Network and CRE-STRIDE 2021; Lansbury Hall and Crosby 2020; McNamara and Westoby 2011; Moggridge and Thompson 2021), for example, by disrupting their connection to Country, exacerbating existing risk factors or compounding historical injustices (Beggs et al. 2021; HEAL Network and CRE-STRIDE 2021; Wright et al. 2023). Holistic, collective First Nations cultural practices that centre on caring for Country (protection and stewardship) and implementing and developing Indigenous Knowledge systems, communities and networks can all support social and emotional wellbeing of First Nations people within the context of climate change. (Wright et al. 2023).
Health system impacts
Climate change is expected to challenge the health care system, for example, through increased need for health care services (such as emergency department usage and hospital admissions), and disruptions to health service provision and health supplies during and in the aftermath of extreme weather events (ACS 2025b) (see Figure 2). Policy reforms, workforce training, and infrastructure redesign, could contribute to building resilience and improving the preparedness of health systems and other societal systems (Braithwaite et al 2024a).
The health care system itself is estimated to be directly or indirectly responsible for around 5.4% of Australia’s total greenhouse emissions, which contribute to climate change (De Sain et al. 2024). Therefore, a reduction in health-related emissions across health systems and their supply chains (e.g. pharmaceutical and medical equipment production and use) could make a significant contribution to lowering greenhouse gas emissions. While the sources of emissions relating to the health system are well-documented, further work is needed to ensure the implementation, evaluation and sustainability of initiatives (Braithwaite et al. 2024b).
Building a climate-resilient health system and health system decarbonisation are key objectives of the National Health and Climate Strategy (Department of Health and Aged Care 2023).
Figure 2: Climate-related risks to health and wellbeing
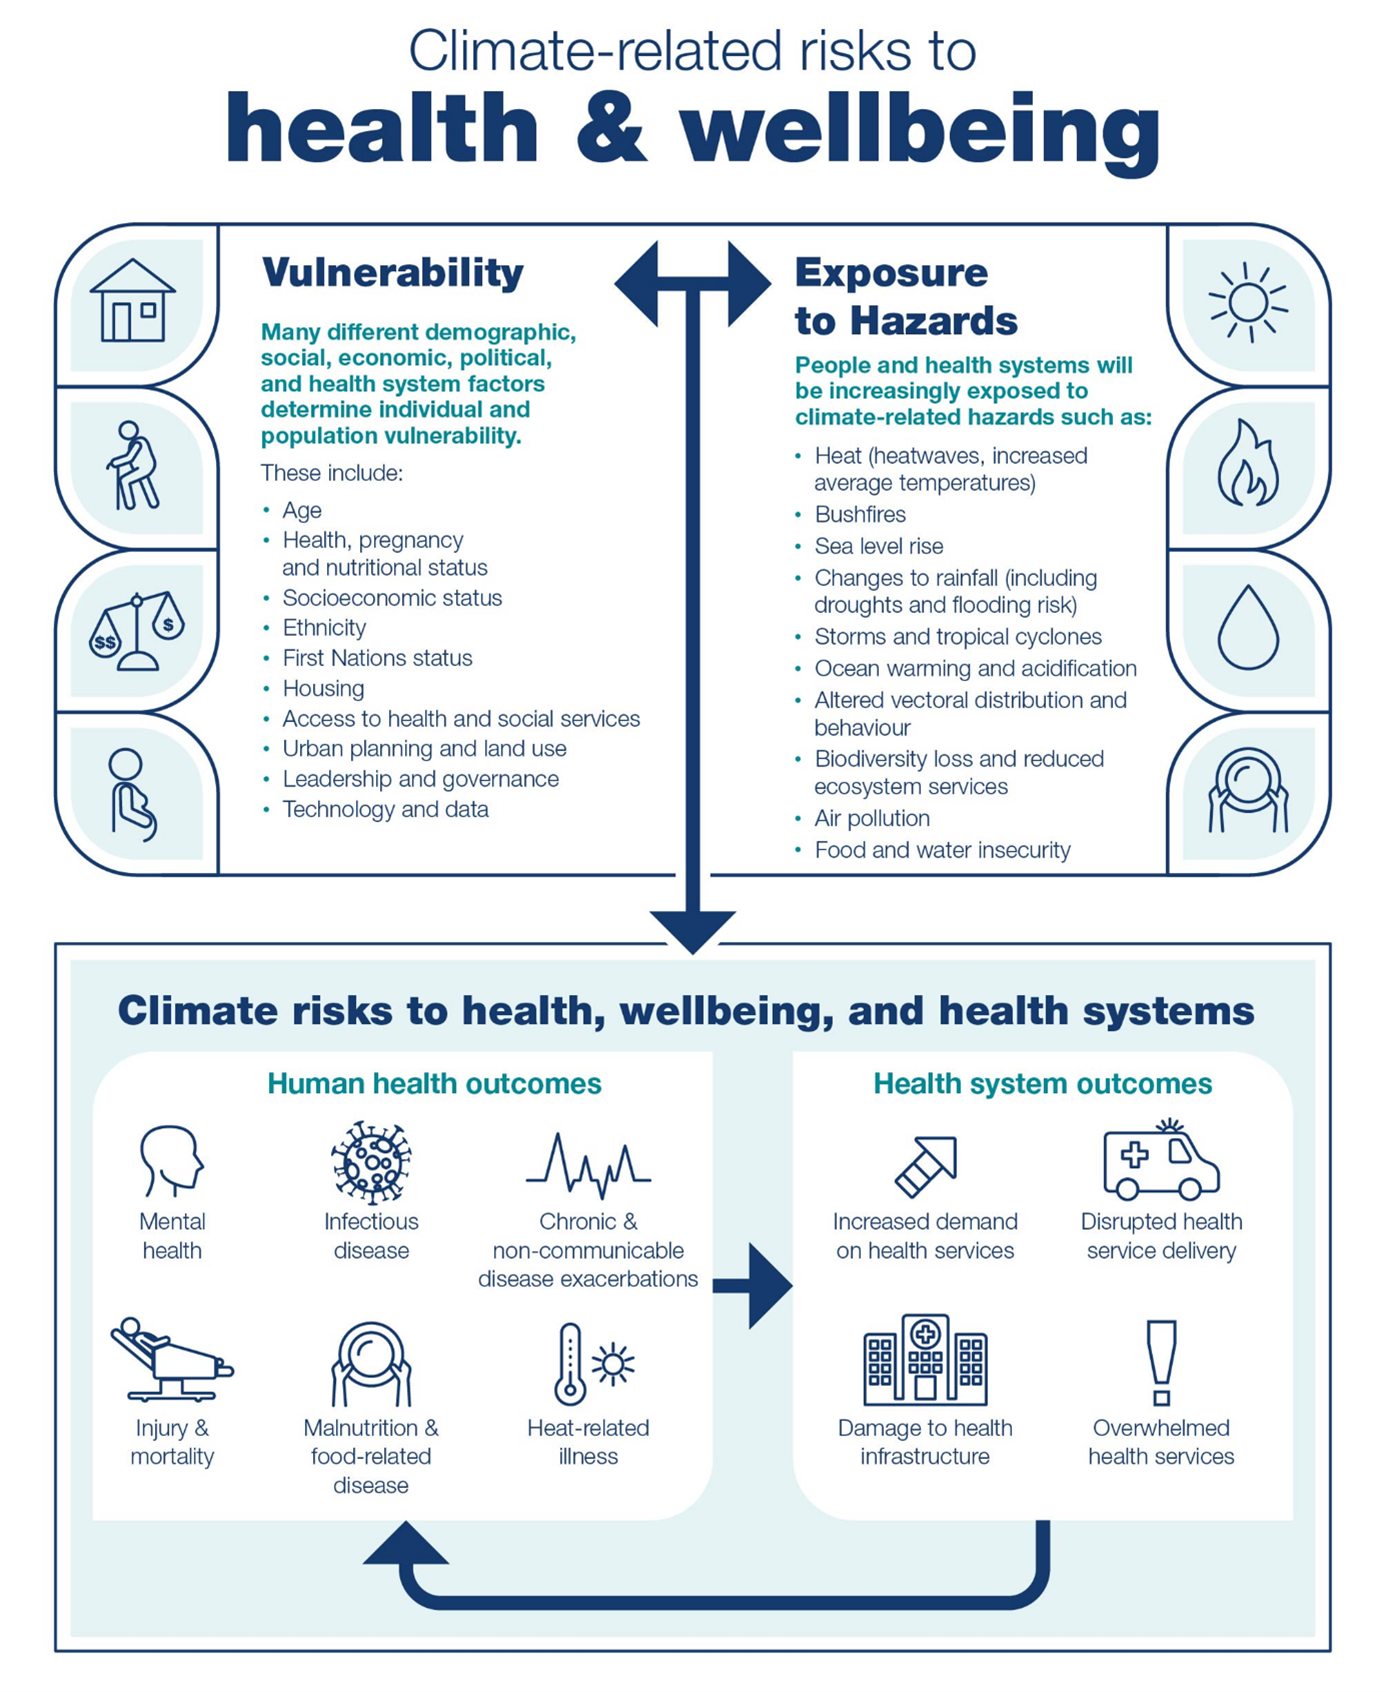
Figure © Commonwealth of Australia (Department of Health and Aged Care) 2023
Key government policy and initiatives
To meet the health challenges posed by climate change, the Australian Government released the National Health and Climate Strategy in 2023. The Strategy and associated implementation plan outlines a whole-of-government approach to build a climate-resilient, net zero health system, and to protect population health and wellbeing from the impacts of climate change (Department of Health and Aged Care 2023; Australian Centre for Disease Control 2024).
The Strategy recognises the interconnectedness of the environment and health, and the need to take a Health in All Policies approach to address climate change and its impacts. Importantly, the Strategy acknowledges the inequitable distribution of health burden due to climate change, and is therefore informed by principles of health equity, including an explicit commitment to working with First Nations stakeholders to address the health impacts of climate change on First Nations people (Department of Health and Aged Care 2023).
In 2025, the Australian government released its first National Climate Risk Assessment (ACS 2025b), which analysed health and wellbeing as a priority risk area. The current climate risk to the health and social support system was assessed as being moderate-to-high, and by 2050, it is expected to be severe. Health impacts of climate change include:
- increasing heat-related illness
- exacerbations of chronic conditions
- higher risk of communicable (including vector-borne) diseases
- rising mental ill-health
- greater morbidity and mortality overall.
Additional health impacts occur through:
- increased transport costs and reduced access to medicines
- exacerbation of health inequalities
- overburdening of health and services infrastructure
- increased biosecurity risk
- reductions in productivity and other economic impacts (ACS 2025b).
Extreme weather events
Hazards
Australia is expected to experience changing weather patterns in the coming decades, with continued climate change intensifying many types of weather events. In Australia, it is predicted that there will be increases in the number, intensity or geographic spread of heatwaves (terrestrial and marine), drought, bushfires, violent storms, heavy rainfall events and flooding, while a decrease in extreme cold weather is expected (ACS 2025a; Bureau of Meteorology and CSIRO 2024; Metcalfe and Costello 2021). Australia may experience more compounding, cascading and concurrent hazard events (ACS 2025a).
Health impacts
Extreme weather events can have direct effects such as deaths, injuries and illness, and can affect mental health and wellbeing (Ebi et al. 2021a; Matthews et al. 2019). In Australia, in the decade between 2012 and 2022 there was an average of 912 hospitalisations per year for injuries alone which were recorded as attributable to extreme weather (AIHW 2024b). This equates to 3.7 hospitalisations per 100,000 people per year. It should be noted that hospitalisations for extreme weather-related injuries represent only a small proportion of the combined direct and indirect health outcomes due to extreme weather, and that the full health impact is likely much higher.
Extreme weather events can also indirectly affect the health of communities through impacts to critical infrastructure, essential services, food production, water quality, the economy and ecosystems (ACS 2025b; Reisinger et al. 2014). Increases in damage caused by extreme weather is also reflected in insurance claims. Over the 5 years to 2024–25, the financial cost of insured extreme weather events was around $22.5 billion, a 67% increase relative to the previous 5-year period (ICA 2025b).
Without mitigation and adaptation, the health impacts of extreme weather events, including compound and cascading events, are likely to increase and disproportionately affect people facing greater levels of risk, such as women, children, older people, people with underlying health conditions, First Nations people, people experiencing financial difficulties, displaced people and future generations (Beggs et al. 2019; Cheng et al. 2018; Thiery et al. 2021; WHO 2021).
Heatwaves and very hot days
Hazard
Though extreme heat varies geographically across Australia, there has been an increase in the frequency of extreme heat events and very hot days, with most warming occurring since 1950. As a result of climate change, the number of severe and extreme heatwave days each year is projected to rise into the future, with the greatest increase in the northern parts of Australia where high levels of humidity can exacerbate the impacts of heat on health (ACS 2025a,b,c; Bureau of Meteorology and CSIRO 2024).
Health impacts
Heatwaves are associated with heat-related health conditions ranging from minor rashes and body cramps to more serious conditions such as heatstroke. Excessive heat can also exacerbate existing health conditions such as heart disease, diabetes, kidney disease and mental and behavioural conditions; reduce productivity; impact outdoor activities (related to work and recreation) and increase the geographical spread of vector-borne diseases and transmission of food-borne diseases such as gastroenteritis (AMA 2015; Ebi et al. 2021b). Some medications can increase the propensity for heat-related illness, and some medications may be less effective during prolonged high temperatures (Layton et al. 2020).
Increases in hospitalisations and deaths in Australia have been observed during heatwaves and extreme heat (Varghese et al. 2020; Williams et al. 2018; Xu et al. 2025). For the period 2007–2017, one epidemiological study estimated deaths increased by 2% during heatwaves in Australia (1,418 additional deaths over the 11-year period), with the highest increases occurring in Adelaide (8%) and regional Tasmania (11%) during that period (Varghese et al. 2020). Another study estimated that there was a 5% increase in the risk of mortality during heatwaves between 2016 and 2019 (Xu et al. 2025). Single events can result in a higher number of deaths than would usually be anticipated. For example, there were 374 additional deaths (a 62% increase in all-cause mortality) in Victoria during the heatwave preceding the 2009 Victorian bushfires from 26 January to 1 February 2009 (DHHS 2009). Extreme heat has the highest contribution to injury-related hospitalisations and deaths that are recorded administratively as being caused by extreme weather events – 7,104 hospitalisations over a 10-year period (from 2012-13 to 2021-22) and 293 deaths (from 2011-12 to 2020-21) (AIHW 2023).
Bushfires
Hazard
Bushfire has long been a part of the Australian experience. However, as a result of climate change, bushfire events are expected to occur more frequently and become more severe due to higher temperatures and drier conditions. The number of dangerous fire weather days is projected to increase with a longer fire season and potential for more megafires in southern and eastern Australia (ACS 2025b).
Health impacts
The 2019–20 bushfire season in Australia saw an unusually large area of Australia’s temperate forest burnt (Boer et al. 2020). The fires resulted in:
- 35 deaths due to injuries (which can include burns or toxic effects of carbon monoxide) resulting from exposure to bushfires (AIHW 2023)
- an estimated 417 additional deaths due to bushfire smoke (based on estimates of the health impact of air pollution in epidemiological research) (Borchers-Arriagada et al. 2020)
- increases in hospital admissions and emergency department presentations for respiratory conditions in areas affected by bushfire smoke (AIHW 2020, 2021; Wen et al. 2022)
- over half (54%) of Australian adults experienced anxiety or worry due to the bushfires (Biddle et al. 2020)
- disproportionate impacts on First Nations people (who comprised a relatively high share of the population in bushfire-affected areas) as well as regions with high fire density and lower socioeconomic status (which experienced higher rates of excess emergency department presentations) (Nolan et al. 2021; Wen et al. 2022; Williamson et al. 2020).
For more detailed information on the 2019–20 bushfires, see Australian bushfires 2019–20: exploring the short-term health impacts and Data update: Short-term health impacts of the 2019–20 bushfires.
While bushfires are a common part of the Australian summer season, the number of deaths they cause varies from year to year, with fatalities concentrated around particular events (Blanchi et al. 2012). The 2009 Victorian bushfires resulted in the death of 173 people (The 2009 Victorian Bushfires Royal Commission 2010). According to a database of known bushfire fatalities, there were 7.4 deaths per year, on average, between 1901 and 2011 (Blanchi et al. 2012).
Smoke generated by bushfires can affect respiratory and cardiovascular health over large geographical areas, as evidenced by increased respiratory and cardiovascular hospital attendances during bushfire events (AIHW 2020, 2021; Borchers Arriagada et al. 2020; Chen et al. 2006; Johnston et al. 2002; Kolbe and Gilchrist 2009; Morgan et al. 2010; Tham et al. 2009; Wen et al. 2022). However, as exposure to bushfire smoke is typically infrequent and sporadic, there is limited information available about prolonged exposure to bushfire smoke or long-term physiological health effects (enHealth 2021). For more information on smoke-related air quality, see Air quality.
There is evidence of both immediate and long-term impacts of bushfire on mental health. Lived experience of bushfire has been found to increase the occurrence of psychological and behavioural disorders such as anxiety, depression, post-traumatic stress disorder (PTSD) and substance misuse, and the effects can persist for years after the impact (Bryant et al. 2018; Finlay 2012; Gao et al. 2023; Gibbs et al. 2021; Rodney et al. 2021).
Drought
Hazard
Australia is drought-prone and many areas have a dry climate. Droughts are expected to become increasingly severe in Australia due to climate change with the time spent in drought likely to increase across large parts of the country (ACS 2025a). Long periods of below-average rainfall adversely affect the natural environment and have flow-on effects for human health (AIHW 2011; Kalis et al. 2009).
Health impacts
Many health effects of drought have been documented globally, including impacts related to water-borne diseases such as those caused by Escherichia coli, airborne and dust-related diseases, vector-borne diseases such as dengue fever, impacts related to food security, mental health effects and distress (Stanke et al. 2013).
The mental health effects of drought are complex and may vary by demographic characteristics. A 2012 study (Hanigan et al. 2012) found an increased risk of suicide among males aged 30–49 living in rural areas of Australia during periods of drought between 1970 and 2007. Findings on the effects of drought on the mental health of women are mixed (Hanigan et al. 2018; Powers et al. 2015). Mental health impacts are more pronounced in rural communities (Batterham et al. 2022), and occupation also appears to play a role. One study found people working on farms were at a much greater risk of mental ill-health as a result of drought, when compared with people employed outside the agricultural sector (Edwards et al. 2015).
Drought can also restrict physical and financial access to healthy foods. It can result in higher prices for primary produce (Quiggin 2007) and adversely impact food security, and relatedly, mental health (Friel et al. 2014).
Storms and floods
Hazard
As a result of climate change, weather systems such as east coast lows and tropical cyclones are expected to become less frequent but more intense, with heavy rainfall events increasing flood risk. In addition, the sea-level rise will exacerbate flood risk in coastal communities and compound the impacts of extreme weather events (ACS 2025a). Changing weather patterns may also increase the risk of thunderstorm asthma events (Beggs 2024), see Air quality.
Health impacts
Health effects from storms and floods may be short-term (for example, physical trauma), medium-term (for example, the spread of vector-borne disease, impacts from dampness and mould in the home) or long-term (such as post-traumatic stress and depression) (Fewtrell and Kay 2008; Ivers and Ryan 2006). Heavy rainfall and flooding can affect the quality of water resources, for example through pollution with run-off from by-products of industry and agriculture, and cross contamination from sewerage infrastructure, contributing to waterborne disease (Matic et al. 2025; van Vliet et al. 2023).
The floods in Australia in 2021–22 had major impacts across large parts of Queensland and New South Wales. Nationally, there were 39 deaths attributed to either flooding or cataclysmic storms during the 2022 calendar year, compared with an average of 6.0 deaths annually over the previous 9 years (ABS 2023, 2025a).
A survey of the disaster-related trauma from the 2010–2011 Queensland floods and cyclones found that 14% of respondents felt terrified, helpless or hopeless following the events and around 7% of respondents continued to experience distress months later (Clemens et al. 2013). Another study, conducted 6 months post-flood, concluded that flooding in Northern New South Wales in 2017 had a profound impact on community members’ psychological health, particularly people displaced from their homes and socioeconomically marginalised groups (Matthews et al. 2019). Persistent post-traumatic stress disorder has also been reported in children and adolescents, 18 months after a Category 5 cyclone (McDermott et al. 2014).
Housing conditions and quality issues can exacerbate vulnerability to the health impacts of flooding, leading to particular risk associated with socioeconomic disadvantage (ACS 2025c). The Insurance Council of Australia estimates that around 35% of households exposed to high levels of flood risk are in areas where the median income is below the poverty line (ICA 2025a). Remoteness also increases risk of death from flooding (AIHW 2019; Peden et al. 2017).
One Health
One Health is a holistic conceptual framework that recognises the links and interdependencies between the health of humans, domestic and wild animals, plants and the wider environment (including ecosystems). The One Health framework aims to optimise the health of people, animals and ecosystems (WHO 2025). Considering these elements together rather than dealing with them in isolation, allows for a more comprehensive understanding of complex health problems (e.g. vector-borne disease), and their potential solutions, than if each element were considered in isolation.
One Health framing has become more important as ecosystems have been put under increasing pressure as a result of human activities (e.g. population growth, industrialised livestock farming, air travel, urban encroachment into natural areas, biodiversity loss due to habitat destruction, environmental pollution and climate change) (Australian Centre for Disease Control 2025). Because of the increased risk of One Health issues such as zoonotic diseases within this context, One Health has become a priority for scientific agencies such as the Australian Centre for Disease Control and CSIRO (Australian Centre for Disease Control 2025; CSIRO 2025).
Water and food
Hazards and health impacts
Climate change is predicted to have an adverse impact on food and water security (Darbyshire et al. 2025; Matic et al. 2025) and changes in climate (for example, warmer temperatures and increased flooding) can lead to increases in food and water-borne disease, particularly gastrointestinal diseases (Fearnley et al. 2024; Harlock et al. 2022; Romanello et al. 2022).
Increased temperature, evaporation and time spent in drought is predicted to reduce water availability in parts of Australia, which presents risks to health as communities turn to alternative and potentially contaminated water sources (Matic et al. 2025). On the other hand, high intensity rainfall and flooding can also increase the risk of drinking-water contamination, particularly from cryptosporidium and cyanobacteria outbreaks (ACS 2025b; Matic et al. 2025).
Rural and remote communities, First Nations people, and groups facing socioeconomic disadvantage are particularly vulnerable to food and water insecurity and related health risks (ACS 2025b; Matic et al. 2025).
Harmful algal blooms
Increased nutrient levels in water bodies (for example, due to fertiliser in agricultural runoff), combined with factors linked with climate (for example, warming of water bodies) can lead to increases in harmful algal blooms in freshwater, estuarine and marine ecosystems. These algal blooms may produce toxins that pose risks to human health, with potential for exposure through direct contact with contaminated water, inhalation of aerosolised toxins, or consumption of contaminated seafood or drinking water. Health effects may vary depending on the type of toxin and route of exposure and may include respiratory, gastrointestinal, neurological and skin symptoms (Brenckman et al. 2025).
In March 2025, an unprecedented harmful algal bloom was identified off the coast of South Australia, resulting in the death of more than one million marine animals, from more than 550 species. Acute respiratory symptoms in humans were also reported (Murray et al. 2025). A marine heatwave that started in September 2024 is considered to have been a contributing factor to the algal bloom and, as of May 2026, the bloom was still present off parts of the South Australian coast (Department of Primary Industries and Regions 2026).
Environmental chemicals and emerging contaminants
Hazards
Environmental chemicals and contaminants in air, water, soil and food may arise from natural sources, historical land use or human activities such as industry, agriculture, mining, waste disposal and urban development. Some environmental chemicals may accumulate in ecosystems and food chains and may have potential to result in long-term exposure in populations. Exposure to environmental chemicals can occur through ingestion of contaminated food or drinking water, inhalation of polluted air or dust, and dermal contact with contaminated soil or water (Australian Centre for Disease Control 2026a; Li et al. 2024).
Health impacts
A wide range of environmental chemical contaminants, including heavy metals, persistent organic pollutants and agricultural chemicals, have been associated with adverse health outcomes. Their health impacts depend on the type of chemical, level and duration of exposure and individual susceptibility (Li et al. 2024). More vulnerable population groups include children, pregnant women, First Nations communities, and people living (or working) in affected geographical areas (ATSDR 2023; Clifford et al. 2015; EHINZ 2026).
Monitoring, risk assessment and management of environmental chemicals are considered critical components of environmental health protection (Li et al. 2024).
Emerging issues
Emerging contaminants such as microplastics may need to be considered. Microplastics are tiny plastic particles that are being detected in the environment, including in air, water, soil and food. Human exposure to microplastics can occur through ingestion, inhalation and dermal contact. While microplastics have been detected in various environmental and human samples, evidence on their direct impacts on human health is still emerging. Current research is focused on understanding exposure pathways, potential biological mechanisms and the long-term health implications of chronic low-level exposure. Ongoing monitoring of evidence and research is required to understand and characterise risks as well as inform health policies (Hossain et al. 2025).
Infectious diseases
Hazard
Infectious diseases spread via a range of different mechanisms. For example, they can be airborne, waterborne, foodborne, spread by vectors or through direct contact. Transmission is affected by the natural environment. Changing temperatures, rainfall, flooding, drought, extreme weather events, wildfire and coastal and oceanic conditions are expected to impact the spread of infectious diseases in future (ACS 2025b; Bambrick et al. 2011; CSIRO 2024; Effler 2020; Jackson et al. 2017; Lau et al. 2018; Hall et al. 2021; Mora et al. 2022; WHO 2021), and potentially lead to pathogen mutations (Boyle et al. 2025). It is estimated that more than half of human pathogenic diseases can be aggravated by climate change, including 103 vector-borne diseases, 78 waterborne diseases, and 60 airborne diseases (Mora et al. 2022).
Infectious diseases linked to the environment that are transmitted from animals to humans are called zoonotic diseases. These diseases can be transmitted by vectors (such as mosquitoes) or through contact with infected animals (such as livestock, mice, rats), or soil or water contaminated with the urine or faeces of infected animals. People working in animal-associated occupations (such as farming) may face higher risk of some zoonotic diseases (Cortes-Ramirez et al. 2021).
Health impacts and recent data
Leptospirosis is caused by bacteria which can survive in soil and infect both animals and humans. While leptospirosis infections are quite rare in Australia (though likely underdetected; see Epps et al. 2026), exposure to flood waters and growth in rodent populations following unusually wet weather have been associated with increased transmission (Australian Centre for Disease Control 2026d; Department of Health 2021; Department of Health and Aged Care 2024; Mwachui et al. 2015; Naing et al. 2019). Other factors that increase the risk of transmission include employment in the agricultural and horticultural industries, working with animals, overseas travel to higher-risk countries, and freshwater recreational activities (Epps et al. 2026; Mwachui et al. 2015; Naing et al. 2019).
Vector-borne diseases in Australia include viral infections such as Ross River virus, Barmah Forest virus, Murray Valley encephalitis virus, Kunjin virus, Japanese encephalitis virus and dengue virus. Dengue virus infection is the most commonly recorded of the notifiable vector-borne diseases and most cases are acquired overseas. This explains the drastic drop in notification following COVID-19 overseas travel restrictions in 2020 and 2021, followed by a rebound in cases in recent years (to around 2000 or more in 2024 and 2025) (Department of Health and Aged Care 2025; Sohail et al. 2024).
Declines in locally-acquired transmission of dengue suggests that the control method of introducing Wolbachia-infected Aedes aegypti mosquitoes has been effective in reducing the risk of acquiring dengue locally (Sohail et al. 2024). However, there was an outbreak of dengue in Townsville during the 2024–25 wet season associated with higher than average rainfall (Thompson et al. 2026). In 2022, there was an outbreak of Japanese encephalitis virus with 41 human cases of the virus (Australian Centre for Disease Control 2026d; McGuinness et al. 2023). Cases of the mosquito-borne parasitic infection, malaria, are recorded each year in Australia in people who have travelled overseas. Outbreaks, though uncommon, have also occurred in Queensland and the Torres Strait (Australian Centre for Disease Control 2026c).
Air quality
Hazard
Air quality refers to the condition of the air that we breathe (DCCEEW 2022a). It is adversely impacted by the presence of aeroallergens and air pollution. Air quality is degraded by human activities, such as burning of fossil fuels for industrial purposes, emissions from vehicle use, and emissions from wood heaters, or through naturally occurring events such as bushfires and dust storms.
Health impacts
Air pollution, including fine airborne particles (particulate matter) known as PM2.5, can have both long- and short-term adverse impacts on human health and can affect almost every organ in the body (AIHW 2011; Schraufnagel et al. 2018). In 2024, 1.6% of the total burden of disease in Australia was attributed to PM2.5 air pollution measured in ambient air (AIHW 2024a).
For some pollutants, including PM2.5, there is evidence that even very low levels of exposure can have adverse health impacts (Brunekreef et al. 2021; Hanigan et al. 2019). Air pollution is recognised by the World Health Organization as a serious risk factor for non-communicable disease (Schwartz et al. 2021). Air pollution can also increase the health impacts of infectious and other respiratory diseases (Tran et al. 2023). Particulates can decrease lung function, increase respiratory symptoms, chronic obstructive pulmonary disease (COPD), dementia, cardiovascular and cardiopulmonary disease and mortality (Pope and Dockery 2006; Rogowski, et al. 2025), and decrease life expectancy (Pope et al. 2009).
While most of the scientific literature focuses on PM2.5, other pollutants such as nitrogen dioxide (NO2), ozone (O3) and sulfur dioxide (SO2) have also been found to impact health (Borchers-Arriagada et al. 2025; Jackson et al. 2017). Indoor air pollution has also been shown to affect health, with the specific pollutants present indoors – and their concentrations – distinct from that of the ambient air, resulting in different impacts (Australian Centre for Disease Control 2026b). Many things adversely impact indoor air quality, including particulate matter from wood heaters, volatile organic compounds from furnishings or building materials, airborne microorganisms (viruses, bacteria, fungi), and emissions from gas heaters, cooktops and stoves (Australian Centre for Disease Control 2026b).
People with an underlying health condition, such as asthma, COPD or cardiovascular disease, people over the age of 65, infants and young children, pregnant women and people with diabetes are particularly at risk from poor air quality (Jackson et al. 2017; enHealth 2024).
Thunderstorm asthma
In 2016, a major asthma epidemic was triggered in Melbourne when very high pollen counts coincided with adverse meteorological conditions in what is known as a ‘thunderstorm asthma’ event. This event resulted in 3,365 people presenting at hospital emergency departments over 30 hours, and 10 deaths (Thien et al. 2018). During the week of the event there were 660 emergency department presentations for asthma, among people residing in the Melbourne West SA4 area alone. This was more than 12 times the number in the same week of the previous year (50 presentations) (AIHW 2024c). For more information, see Chronic respiratory conditions: asthma.
While much PM2.5 pollution is derived from human activity, it can also be generated from extreme weather-related events such as bushfires and dust storms (Emmerson and Keywood 2021). In 2019 and 2020, air quality, particularly in New South Wales, the Australian Capital Territory, Victoria and Queensland, was greatly affected by widespread bushfires (AIHW 2020, 2021; Johnston et al. 2021) (Figure 3). There were significant health impacts associated with this event, see Bushfires section.
Prolonged exposure to smoke from the 2014 Hazelwood mine fire was associated with a range of short-, medium- and long-term health impacts. Most health impacts had resolved by nine years post-fire, however there were still some lingering effects of the fire at the conclusion of the study (Hazelwood Health Study 2025).
Figure 3: Daily average PM2.5 concentrations in Canberra and Sydney, January 2019 to January 2020
The line graph shows the daily PM2.5 concentrations from January 2019 to the month of October 2019 remaining relatively low at both Sydney and Canberra’s air quality monitoring stations, mainly rated as ‘Good’ or ‘Fair’ air quality. From October 2019 through to January 2020, there is a dramatic increase in average daily PM2.5 concentrations in both Canberra and Sydney stations, with more days rated as being ‘Poor’, ‘Very poor’ or ‘Extremely poor’ air quality.
