Years lived with disability (YLD)
On this page:
- Estimating the non-fatal burden
- Overview of methods
- Conceptual disease models
- Disability weights
- Estimating point prevalence of each sequela
- Data sources
- Indigenous considerations
- Severity distributions
- Modelling practices
- Estimating the total prevalence of conditions that are sequela to many diseases
- Dealing with comorbidity
- Estimating YLD for residual diseases
Estimating the non-fatal burden
Expressed as years lived with disability (YLD), non-fatal burden is a measure of healthy years lost due to ill health. YLD estimation captures the frequency, severity, comorbidities and consequences of each disease in the disease list, and quantifies their joint impact on the population in terms of the difference between time lived in full health and time lived with one or more health problems (ill health).
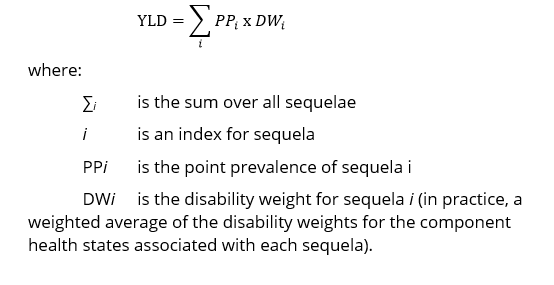
YLD estimates in the ABDS 2018 are based on prevalent cases (the number of people experiencing each disease) at a given point in time. YLD are calculated from the point prevalence (the number of people experiencing health loss from the condition on a given day) multiplied by a disability weight (which reflects the severity of the disease). As such, YLD should be interpreted as the total number of years spent in less than full health by the population in the reference year, weighted according to the health loss associated with each disease.
YLD estimation requires some important methodological decisions, including, but not limited to, the choice of conceptual disease models, severity distributions, disability weights, and the adjustment for comorbidity. Also, some complex estimation problems result from the fact that the available data are often not in the form or at the granularity required.
Box 3.3: Key terms used in this chapter
comorbidity: A health problem/disease that exists at the same time as (an)other health problem(s).
conceptual disease model: Representation of clinical conditions designed to summarise what is known about the disease epidemiology, the nature of the disease (that is, whether it is chronic, acute, episodic or progressive), and its treatment.
disability weight: A factor that reflects the severity of health loss from a particular condition on a scale from 0 (perfect health) to 1 (equivalent to death).
envelope: The total prevalence of a condition present in the population that is used to constrain the combined prevalence of sequelae common to a number of diseases.
health state: Reflects a combination of signs and symptoms that result in health loss and are not necessarily unique to a particular disease. Each sequela is linked to a specific health state—this may be a single health state or multiple health states to account for severity. For example, heart failure is a sequela of coronary heart disease and has 3 severity levels of mild, moderate and severe. Each health state is mapped to a disability weight which reflects the severity of health loss.
incidence: Refers to the occurrence of a disease or event. The incidence rate is the number of new cases occurring during a specified time period.
prevalence: Refers to the existence of a disease or event, whether or not it is newly occurring; the prevalence rate is the number of cases existing at a point in time (point prevalence) or over a specified time period (period prevalence).
sequelae: Health consequences of diseases and injuries. For example, heart failure is a sequela of coronary heart disease.
Overview of methods
YLD measures the impact of living with ill health—that is, the non-fatal component of burden of disease. YLL (discussed in Years of life lost (YLL)) represents the fatal component.
The findings of the ABDS 2018 are reported for 218 diseases, including two reporting categories for injuries—‘External cause of injury’ and ‘Nature of injury’, that constitute the disease list for the study (see ABDS 2018 list of diseases).
YLD estimates are achieved using the following steps:
- Develop a conceptual model for each disease, which includes main sequelae of the disease and severity of sequela (if required).
- Map each sequela/severity to a health state and disability weight for all diseases
- Estimate point prevalence by age and sex for each sequelae/ severity.
- Calculate YLD for each disease, which is estimated up from the sequela level (for each age and sex), described as:
Conceptual disease models
Fundamental to YLD estimation are epidemiological models that describe the evolution of a disease (for example, onset, duration, remission and case fatality) and its relationship with epidemiological variables (such as incidence, prevalence and mortality).
As the disability weights adopted for the ABDS 2018 are provided at the health state level, these epidemiological models needed to be converted into simpler conceptual models. These models describe the significant outcomes (sequelae) of each disease, the health states that best represent the health loss from each outcome as well as the time spent in this state. These conceptual models underpin all YLD estimates for the ABDS 2018 analysis.
The conceptual models were developed by the AIHW in conjunction with disease experts. In many cases, a conceptual model was based on models used in previous burden of disease studies.
Defining sequelae and health states
One or more sequelae were defined for each disease in the disease list. Due to the difficulty of assembling data with the granularity and dimensions required for YLD estimation, only sequelae causing significant health loss were included in the conceptual models.
Within a single disease, a person could have any number of sequelae simultaneously—for example, a person experiencing health loss from diabetes might at the same time have health loss from diabetic foot and vision impairment due to diabetes. A person might also have multiple sequelae from multiple diseases simultaneously—for example, a person with health loss from diabetic foot might also have heart failure due to coronary heart disease. The impact of multiple sequelae are adjusted for in the comorbidity bias adjustment.
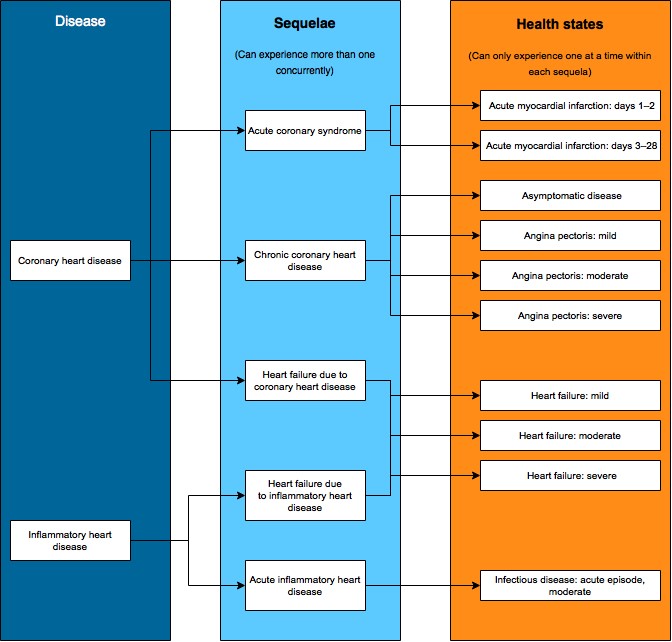
Each sequela is then mapped to one or more health states. Health states are the functional consequences or symptoms experienced by people with each disease sequela—for example, heart failure is the functional consequence of heart failure regardless of whether it is due to coronary heart disease, cardiomyopathy or rheumatic heart disease. Multiple states within a sequela indicate its severity (for example, mild, moderate, severe heart failure) or disease progression (such as diagnosis and treatment, controlled, metastatic and terminal phases of cancer). As a result, within each sequela, a person can only be in one health state at any given point in time.
An example showing how coronary heart disease and inflammatory heart disease map through sequelae to health states is provided in the figure below. The list of sequelae for each disease and resultant health states are summarised in the disease-specific sections.
Figure 3.1: Example mapping coronary heart disease and inflammatory heart disease to component health states
Disability weights
Sequelae map to one or more health states, which each have an associated disability weight reflecting the health loss experienced by a person while in that health state. Disability weights express the health loss on a scale from 0 (no health loss) to 1 (total health loss).
To provide a set of weights for such large numbers of sequelae, the GBD 2010 pioneered the practice of using estimates of the health losses associated with a smaller set of health states to which each of the sequelae can be mapped. These were originally derived for the GBD 2010 from a large, multinational, cross-cultural study (Salomon 2010; Salomon et al. 2012) and further refined for the GBD 2013 (GBD 2013 Collaborators 2015). The GBD 2013 disability weights were used in the ABDS 2011, 2015 and 2018.
The 351 sequelae in the ABDS 2018 were mapped to 195 of the 236 available health states (see ABDS 2018 health states and disability weights). This resulted in 745 sequela–health state combinations that included the different severity levels (such as mild, moderate and severe).
|
ABDS 2018 health state ID |
Health state name |
Disability weight |
|---|---|---|
|
1 |
Infectious disease: acute episode, mild |
0.006 |
|
2 |
Infectious disease: acute episode, moderate |
0.051 |
|
3 |
Infectious disease: acute episode, severe |
0.133 |
|
4 |
Infectious disease: post-acute consequences (fatigue, emotional lability, insomnia) |
0.219 |
|
5 |
Diarrhoea: mild |
0.074 |
|
6 |
Diarrhoea: moderate |
0.188 |
|
7 |
Diarrhoea: severe |
0.247 |
|
8 |
Epididymo-orchitis |
0.128 |
|
9 |
Herpes zoster |
0.058 |
|
10 |
HIV: symptomatic, pre-AIDS |
0.274 |
|
11 |
HIV/AIDS: receiving antiretroviral treatment |
0.078 |
|
12 |
AIDS: not receiving antiretroviral treatment |
0.582 |
|
13 |
Intestinal nematode infections: symptomatic |
0.027 |
|
14 |
Lymphatic filariasis: symptomatic |
0.109 |
|
15 |
Ear pain |
0.013 |
|
16 |
Tuberculosis: without HIV infection |
0.333 |
|
17 |
Tuberculosis: with HIV infection |
0.408 |
|
18 |
Cancer: diagnosis and primary therapy |
0.288 |
|
19 |
Cancer: metastatic |
0.451 |
|
20 |
Mastectomy |
0.036 |
|
21 |
Stoma |
0.095 |
|
22 |
Terminal phase: with medication (for cancers, end-stage kidney or liver disease) |
0.54 |
|
23 |
Terminal phase: without medication (for cancers, end-stage kidney or liver disease) |
0.569 |
|
24 |
Acute myocardial infarction: days 1–2 |
0.432 |
|
25 |
Acute myocardial infarction: days 3–28 |
0.074 |
|
26 |
Angina pectoris: mild |
0.033 |
|
27 |
Angina pectoris: moderate |
0.08 |
|
28 |
Angina pectoris: severe |
0.167 |
|
29 |
Cardiac conduction disorders and cardiac dysrhythmias |
0.224 |
|
30 |
Claudication |
0.014 |
|
31 |
Heart failure: mild |
0.041 |
|
32 |
Heart failure: moderate |
0.072 |
|
33 |
Heart failure: severe |
0.179 |
|
34 |
Stroke: long-term consequences, mild |
0.019 |
|
35 |
Stroke: long-term consequences, moderate |
0.07 |
|
36 |
Stroke: long-term consequences, moderate plus cognition problems |
0.316 |
|
37 |
Stroke: long-term consequences, severe |
0.552 |
|
38 |
Stroke: long-term consequences, severe plus cognition problems |
0.588 |
|
39 |
Diabetic foot |
0.02 |
|
40 |
Diabetic neuropathy |
0.133 |
|
41 |
Chronic kidney disease (stage IV) |
0.104 |
|
42 |
End-stage renal disease: with kidney transplant |
0.024 |
|
43 |
End-stage renal disease: on dialysis |
0.571 |
|
44 |
Decompensated cirrhosis of the liver |
0.178 |
|
45 |
Gastric bleeding |
0.325 |
|
46 |
Crohn's disease or ulcerative colitis |
0.231 |
|
47 |
Benign prostatic hypertrophy: symptomatic |
0.067 |
|
48 |
Urinary incontinence |
0.139 |
|
49 |
Impotence |
0.017 |
|
50 |
Infertility: primary |
0.008 |
|
51 |
Infertility: secondary |
0.005 |
|
52 |
Asthma: controlled |
0.015 |
|
53 |
Asthma: partially controlled |
0.036 |
|
54 |
Asthma: uncontrolled |
0.133 |
|
55 |
Chronic obstructive pulmonary disease (COPD) and other chronic respiratory diseases: mild |
0.019 |
|
56 |
COPD and other chronic respiratory diseases: moderate |
0.225 |
|
57 |
COPD and other chronic respiratory diseases: severe |
0.408 |
|
58 |
Dementia: mild |
0.069 |
|
59 |
Dementia: moderate |
0.377 |
|
60 |
Dementia: severe |
0.449 |
|
61 |
Headache: migraine |
0.441 |
|
62 |
Headache: tension-type |
0.037 |
|
63 |
Multiple sclerosis: mild |
0.183 |
|
64 |
Multiple sclerosis: moderate |
0.463 |
|
65 |
Multiple sclerosis: severe |
0.719 |
|
70 |
Parkinson disease: mild |
0.01 |
|
71 |
Parkinson disease: moderate |
0.267 |
|
72 |
Parkinson disease: severe |
0.575 |
|
73 |
Alcohol use disorder: mild |
0.235 |
|
74 |
Alcohol use disorder: moderate |
0.373 |
|
75 |
Alcohol use disorder: severe |
0.57 |
|
76 |
Fetal alcohol syndrome: mild |
0.016 |
|
77 |
Fetal alcohol syndrome: moderate |
0.056 |
|
78 |
Fetal alcohol syndrome: severe |
0.179 |
|
79 |
Cannabis dependence |
0.266 |
|
80 |
Amphetamine dependence |
0.486 |
|
81 |
Cocaine dependence |
0.479 |
|
82 |
Heroin and other opioid dependence |
0.697 |
|
83 |
Anxiety disorders: mild |
0.03 |
|
84 |
Anxiety disorders: moderate |
0.133 |
|
85 |
Anxiety disorders: severe |
0.523 |
|
86 |
Major depressive disorder: mild episode |
0.145 |
|
87 |
Major depressive disorder: moderate episode |
0.396 |
|
88 |
Major depressive disorder: severe episode |
0.658 |
|
89 |
Bipolar disorder: manic episode |
0.492 |
|
90 |
Bipolar disorder: residual state |
0.032 |
|
91 |
Schizophrenia: acute state |
0.778 |
|
92 |
Schizophrenia: residual state |
0.588 |
|
93 |
Anorexia nervosa |
0.224 |
|
94 |
Bulimia nervosa |
0.223 |
|
95 |
Attention deficit hyperactivity disorder |
0.045 |
|
96 |
Conduct disorder |
0.241 |
|
97 |
Asperger syndrome |
0.104 |
|
98 |
Autism |
0.262 |
|
99 |
Intellectual disability: mild |
0.043 |
|
100 |
Intellectual disability: moderate |
0.1 |
|
101 |
Intellectual disability: severe |
0.16 |
|
102 |
Intellectual disability: profound |
0.2 |
|
103 |
Hearing loss: mild |
0.01 |
|
104 |
Hearing loss: moderate |
0.027 |
|
105 |
Hearing loss: severe |
0.158 |
|
106 |
Hearing loss: profound always |
0.204 |
|
107 |
Hearing loss: complete |
0.215 |
|
108 |
Hearing loss: mild, with ringing |
0.021 |
|
109 |
Hearing loss: moderate, with ringing |
0.074 |
|
110 |
Hearing loss: severe, with ringing |
0.261 |
|
111 |
Hearing loss: profound, with ringing |
0.277 |
|
112 |
Hearing loss: complete, with ringing |
0.316 |
|
113 |
Distance vision: mild impairment |
0.003 |
|
114 |
Distance vision: moderate impairment |
0.031 |
|
115 |
Distance vision: severe impairment |
0.184 |
|
116 |
Distance vision blindness |
0.187 |
|
117 |
Near vision impairment |
0.011 |
|
126 |
Musculoskeletal problems: legs, mild |
0.023 |
|
127 |
Musculoskeletal problems: legs, moderate |
0.079 |
|
128 |
Musculoskeletal problems: legs, severe |
0.165 |
|
129 |
Musculoskeletal problems: arms, mild |
0.028 |
|
130 |
Musculoskeletal problems: arms, moderate |
0.117 |
|
131 |
Musculoskeletal problems: generalised, moderate |
0.317 |
|
132 |
Musculoskeletal problems: generalised, severe |
0.581 |
|
133 |
Gout: acute |
0.295 |
|
134 |
Amputation of finger(s), excluding thumb: long term, with treatment |
0.005 |
|
135 |
Amputation of thumb: long term |
0.011 |
|
137 |
Amputation of both arms: long term, with treatment |
0.123 |
|
138 |
Amputation of both arms: long term, without treatment |
0.383 |
|
139 |
Amputation of toe |
0.006 |
|
140 |
Amputation of one leg: long term, with treatment |
0.039 |
|
141 |
Amputation of one leg: long term, without treatment |
0.173 |
|
142 |
Amputation of both legs: long term, with treatment |
0.088 |
|
143 |
Amputation of both legs: long term, without treatment |
0.443 |
|
144 |
Burns of <20% total surface area without lower airway burns: short term, with or without treatment |
0.141 |
|
145 |
Burns of <20% total surface area or <10% total surface area if head or neck, or hands or wrist involved: long term, with or without treatment |
0.016 |
|
146 |
Burns of >=20% total surface area: short term, with or without treatment |
0.314 |
|
147 |
Burns of >=20% total surface area or >=10% total surface area if head or neck, or hands or wrist involved: long term, with treatment |
0.135 |
|
148 |
Burns of> =20% total surface area or >=10% total surface area if head or neck, or hands or wrist involved: long term, without treatment |
0.455 |
|
149 |
Lower airway burns: with or without treatment |
0.376 |
|
150 |
Crush injury: short or long term, with or without treatment |
0.132 |
|
151 |
Dislocation of hip: long term, with or without treatment |
0.016 |
|
152 |
Dislocation of knee: long term, with or without treatment |
0.113 |
|
153 |
Dislocation of shoulder: long term, with or without treatment |
0.062 |
|
154 |
Other injuries of muscle and tendon (includes sprains, strains, and dislocations other than shoulder, knee, or hip) |
0.008 |
|
155 |
Drowning and non-fatal submersion: short or long term, with or without treatment |
0.247 |
|
156 |
Fracture of clavicle, scapula, or humerus: short or long term, with or without treatment |
0.035 |
|
157 |
Fracture of face bone: short or long term, with or without treatment |
0.067 |
|
158 |
Fracture of foot bones: short term, with or without treatment |
0.026 |
|
159 |
Fracture of foot bones: long term, without treatment |
0.026 |
|
160 |
Fracture of hand: short term, with or without treatment |
0.01 |
|
161 |
Fracture of hand: long term, without treatment |
0.014 |
|
162 |
Fracture of neck of femur: short term, with or without treatment |
0.258 |
|
163 |
Fracture of neck of femur: long term, with treatment |
0.058 |
|
164 |
Fracture of neck of femur: long term, without treatment |
0.402 |
|
165 |
Fracture other than neck of femur: short term, with or without treatment |
0.111 |
|
166 |
Fracture other than neck of femur: long term, without treatment |
0.042 |
|
167 |
Fracture of patella, tibia or fibula, or ankle: short term, with or without treatment |
0.05 |
|
168 |
Fracture of patella, tibia or fibula, or ankle: long term, with or without treatment |
0.055 |
|
169 |
Fracture of pelvis: short term |
0.279 |
|
170 |
Fracture of pelvis: long term |
0.182 |
|
171 |
Fracture of radius or ulna: short term, with or without treatment |
0.028 |
|
172 |
Fracture of radius or ulna: long term, without treatment |
0.043 |
|
173 |
Fracture of skull: short or long term, with or without treatment |
0.071 |
|
174 |
Fracture of sternum or fracture of 1 or 2 ribs: short term, with or without treatment |
0.103 |
|
175 |
Fracture of vertebral column: short or long term, with or without treatment |
0.111 |
|
176 |
Fractures: treated, long term |
0.005 |
|
177 |
Injured nerves: short term |
0.1 |
|
178 |
Injured nerves: long term |
0.113 |
|
179 |
Injury to eyes: short term |
0.054 |
|
180 |
Severe traumatic brain injury: short term, with or without treatment |
0.214 |
|
181 |
Traumatic brain injury: long-term consequences, minor, with or without treatment |
0.094 |
|
182 |
Traumatic brain injury: long-term consequences, moderate, with or without treatment |
0.231 |
|
183 |
Traumatic brain injury: long-term consequences, severe, with or without treatment |
0.637 |
|
184 |
Open wound: short term, with or without treatment |
0.006 |
|
185 |
Poisoning: short term, with or without treatment |
0.163 |
|
186 |
Severe chest injury: long term, with or without treatment |
0.047 |
|
187 |
Severe chest injury: short term, with or without treatment |
0.369 |
|
188 |
Spinal cord lesion below neck: treated |
0.296 |
|
189 |
Spinal cord lesion below neck: untreated |
0.623 |
|
190 |
Spinal cord lesion at neck: treated |
0.589 |
|
191 |
Spinal cord lesion at neck: untreated |
0.732 |
|
192 |
Abdominopelvic problem: mild |
0.011 |
|
193 |
Abdominopelvic problem: moderate |
0.114 |
|
194 |
Abdominopelvic problem: severe |
0.324 |
|
195 |
Anaemia: mild |
0.004 |
|
196 |
Anaemia: moderate |
0.052 |
|
197 |
Anaemia: severe |
0.149 |
|
198 |
Periodontitis |
0.007 |
|
199 |
Dental caries: symptomatic |
0.01 |
|
200 |
Severe tooth loss |
0.067 |
|
201 |
Disfigurement: level 1 |
0.011 |
|
202 |
Disfigurement: level 2 |
0.067 |
|
203 |
Disfigurement: level 3 |
0.405 |
|
204 |
Disfigurement: level 1 with itch or pain |
0.027 |
|
205 |
Disfigurement: level 2, with itch or pain |
0.188 |
|
206 |
Disfigurement: level 3, with itch or pain |
0.576 |
|
207 |
Generic uncomplicated disease: worry and daily medication |
0.049 |
|
208 |
Generic uncomplicated disease: anxiety about diagnosis |
0.012 |
|
209 |
Iodine-deficiency goitre |
0.199 |
|
210 |
Kwashiorkor |
0.051 |
|
211 |
Severe wasting |
0.128 |
|
212 |
Speech problems |
0.051 |
|
213 |
Motor impairment: mild |
0.01 |
|
214 |
Motor impairment: moderate |
0.061 |
|
215 |
Motor impairment: severe |
0.402 |
|
216 |
Motor plus cognitive impairments: mild |
0.031 |
|
217 |
Motor plus cognitive impairments: moderate |
0.203 |
|
218 |
Motor plus cognitive impairments: severe |
0.542 |
|
219 |
Rectovaginal fistula |
0.501 |
|
233 |
Low back pain, moderate |
0.054 |
|
234 |
Low back pain, mild |
0.02 |
|
235 |
Alcohol use disorder, very mild |
0.123 |
|
236 |
Amphetamine dependence, mild |
0.079 |
|
237 |
Amputation of 1 upper limb (long term, with treatment) |
0.039 |
|
238 |
Amputation of 1 upper limb (long term, without treatment) |
0.118 |
|
239 |
Back pain, most severe, with leg pain |
0.384 |
|
240 |
Back pain, most severe, without leg pain |
0.372 |
|
241 |
Back pain, severe, with leg pain |
0.325 |
|
242 |
Back pain, severe, without leg pain |
0.272 |
|
243 |
Borderline intellectual functioning |
0.011 |
|
244 |
Cannabis dependence, mild |
0.039 |
|
245 |
Cocaine dependence, mild |
0.116 |
|
246 |
Concussion |
0.11 |
|
247 |
Distance vision, monocular |
0.017 |
|
248 |
Epilepsy, less severe (seizures less than once per month) |
0.263 |
|
249 |
Epilepsy, severe (seizures once per month or more) |
0.552 |
|
250 |
Headache, medication overuse |
0.223 |
|
251 |
Heroin and other opioid dependence, mild |
0.335 |
|
252 |
Hyperthyroidism |
0.145 |
|
253 |
Hypothyroidism |
0.019 |
|
254 |
Mild low back pain with leg pain |
0.02 |
|
255 |
Moderate low back pain with leg pain |
0.054 |
|
256 |
Neck pain, mild |
0.053 |
|
257 |
Neck pain, moderate |
0.114 |
|
258 |
Neck pain, severe |
0.229 |
|
259 |
Neck pain, most severe |
0.304 |
|
260 |
Stress incontinence |
0.02 |
|
261 |
Thrombocytopenic purpura |
0.159 |
|
262 |
Asymptomatic disease |
0 |
Source: GBD 2015.
Estimating point prevalence of each sequela
Point prevalence is the number of cases at a given point in time. This differs from period prevalence, which refers to the number of cases during a period of time, such as 1 year. The ABDS 2018 estimated point prevalence as at 30 June 2018, 30 June 2015, 30 June 2011 and 30 June 2003.
The YLD estimation requires point prevalence at the sequela–health state levels for every disease at the age–sex level. In practice, such rich data rarely exist. The data may be expressed in other forms (such as period prevalence or incidence). Further, the measures that might be used to model point prevalence (such as incidence, period prevalence or mortality) are usually available only at the disease level, rather than at the finer sequela or health state level. As a result, point prevalence at the sequela-health state levels was generally modelled from those broader data sources, or, where no empirical data existed, was based on assumptions validated by disease experts. For a list of disease-specific experts, see Expert advice and review.
Data sources
Unlike mortality data, there is no single comprehensive and reliable source of data on the incidence, prevalence, severity and duration of all non-fatal health conditions. Instead, morbidity estimates were drawn from a wide variety of existing sources of epidemiological measures (such as incidence, prevalence and mortality) from disease registers, administrative data, surveys and epidemiological studies.
In many cases, a single primary source provided enough information, but multiple sources were often needed to provide a complete set of data for each disease—for example, for all ages, for population subgroups or for the different sequelae.
No new surveys or meta-analyses of the epidemiological or clinical literature were undertaken as part of the ABDS 2018. This study drew on the findings of meta-analyses done for the GBD or by other investigators.
Major data sources used to estimate prevalence, incidence or other epidemiological parameters included the National Hospital Morbidity Database (NHMD) and the Australian Cancer Database (ACD) held by the AIHW, and the Australian Health Survey (AHS) 2011–12 and the National Health Survey (NHS) 2014–15 and NHS 2017–18 held by the ABS. For further information on these data sources, including data quality statements, see Australian Health Survey: First results, 2011–12, National Health Survey: First results, 2014–15 and National Health Survey: First results, 2017–18.
Primary data sources used for each disease are summarised in the table below.
| Disease group | Key national data sources |
|---|---|
| Blood & metabolic disorders | National Hospital Morbidity Database |
| National Health Survey 2017–18 | |
| Australian Health Survey 2011–12 | |
| Australian Cystic Fibrosis Data Registry | |
| Australian Bleeding Disorders Registry | |
| Linked hospitals and NDI components for the NIHSI AA v0.5 database | |
| Epidemiological studies | |
| Cancer & other neoplasms | Australian Cancer Database |
| National Mortality Database | |
| National Hospital Morbidity Database | |
| Medicare Benefits Schedule | |
| Epidemiological studies | |
| Cardiovascular diseases | National Hospital Morbidity Database |
| Linked hospitals and NDI components for the NIHSI AA v0.5 database | |
| New Zealand Burden of Disease Study | |
| Epidemiological studies | |
| Endocrine disorders | National Diabetes Register |
| National Health Survey 2017–18 | |
| Fremantle Diabetes Study | |
| Gastrointestinal disorders | National Hospital Morbidity Database |
| Linked hospitals and NDI components for the NIHSI AA v0.5 database | |
| Australian and New Zealand Liver Transplant Registry | |
| New Zealand Burden of Disease Study | |
| Epidemiological studies | |
| Hearing & vision disorders | National Health Survey 2017–18 |
| Australian Health Survey 2011–12 | |
| Australian Hearing Database | |
| Blue Mountains Hearing Study | |
| Melbourne Vision Impairment Project | |
| National Eye Health Survey | |
| Epidemiological studies | |
| Infant & congenital conditions | National Hospital Morbidity Database |
| National Mortality Database | |
| National Perinatal Data Collection | |
| Western Australian Intellectual Disability Exploring Answers database | |
| Western Australian Register of Developmental Anomalies | |
| Australian Cerebral Palsy Register | |
| Infectious diseases | National Notifiable Diseases Surveillance System |
| National Hospital Morbidity Database | |
| Australian and New Zealand Assisted Reproductive Database | |
| Bettering the Evaluation and Care of Health | |
| Epidemiological studies | |
| National HIV Register | |
| Injuries | National Hospital Morbidity Database |
| National Non-Admitted Patient Emergency Department Care Database | |
| Kidney and urinary diseases | Australian and New Zealand Dialysis and Transplantation Registry |
| National Hospital Morbidity Database | |
| Australian Health Survey 2011–12 | |
| Linked hospitals and NDI components for the NIHSI AA v0.5 database | |
| Mental and substance use disorders | National Survey of Mental Health and Wellbeing |
| Young Minds Matter survey | |
| Western Australian Intellectual Disability Exploring Answers database | |
| The Australian National Survey of High Impact Psychosis | |
| Alcohol and Other Drug Treatment Services National Minimum Dataset | |
| Global Burden of Disease Study 2017 and 2019 | |
| Musculoskeletal conditions | National Health Survey 2017–18 |
| Neurological conditions | National Hospital Morbidity Database |
| National Health Survey 2014–15 | |
| AIHW dementia analyses | |
| Epidemiological studies | |
| Linked hospitals and NDI components for the NIHSI AA v0.5 database | |
| Oral disorders | National Survey of Adult Oral Health |
| National Dental Telephone Interview Survey | |
| Child Dental Health Survey | |
| Reproductive and maternal conditions | National Hospital Morbidity Database |
| Australian and New Zealand Assisted Reproduction Database | |
| Australian Longitudinal Study on Women’s Health | |
| Bettering the Evaluation and Care of Health | |
| Epidemiological studies | |
| Respiratory diseases | National Mortality Database |
| National Hospital Morbidity Database | |
| Western Australian linked data | |
| National Health Survey 2017–18 | |
| Burden of Obstructive Lung Disease study | |
| Global Burden of Disease Study | |
| Epidemiological studies | |
| Skin disorders | National Health Survey 2017–18 |
| National Hospital Morbidity Database | |
| Bettering the Evaluation and Care of Health | |
| AIHW GEN Aged Care data | |
| Epidemiological studies |
To estimate point prevalence, the ABDS needed data relating to people rather than clinical events. The NHMD was a key data source for some diseases. However, since it provides counts of the number of hospital separations rather than the number of individual patients, AIHW analyses of linked hospitalisations and deaths data from the NIHSI AA v0.5 was used to calculate people–to–hospitalisations ratios using linked hospital and deaths data for New South Wales, Victoria, South Australia and Tasmania for selected sequelae. These ratios were then applied to corresponding hospitalisation counts by sex and age from the NHMD to derive a count of people. This approach assumed that the other states and territories have the same hospital presentation ratio as New South Wales, Victoria, South Australia and Tasmania combined.
The NIHSI AA is a deidentified enduring linked data asset holding data from 2010–11 onwards on admitted patient care services (APC) (in public and private hospitals where available), emergency department (ED) services and outpatient (NAP) services in public hospitals for all participating states and territories, along with Medicare Benefits Schedule MBS data, Pharmaceutical Benefits Scheme PBS and Repatriation Pharmaceutical Benefits Scheme (RPBS) data, Residential Aged Care Services (RACS) data and National Deaths Index (NDI) data. The ABDS 2018 used the hospitals and the NDI data from 2010–11 to 2016–17. It did not use the MBS, PBS, RPBS or RACS components of the database. In addition to people–to–hospitalisations ratios, data from the NIHSI AA were used to derive rates to estimate point prevalence for specific sequela; details for these can be found in Disease-specific methods - morbidity.
Linked hospitals and deaths data from Western Australia were also used to calculate people–to–hospitalisations ratios using linked data for selected sequelae and for Indigenous-specific estimates. This and other usage of linked data is described in Disease-specific methods - morbidity.
Indigenous considerations
Adjusting for Indigenous under-identification in hospitals data
Indigenous Australians are under-identified in hospitals data to varying degrees across state and territory and remoteness areas. This results in an underestimate of hospitalisations of Indigenous Australians. In the ABDS 2018, hospitalisation data used to calculate Indigenous YLD estimates were adjusted for Indigenous under-identification using adjustment factors from hospital data quality studies done by the AIHW (Indigenous hospital adjustment factors in Years lived with disability (YLD)). These studies were undertaken on admitted patients in public hospitals only, and estimates were not adjusted for the casemix of patients or private hospitals. Data used for reference year 2018 were adjusted based on evidence from the 2011–12 data quality study (AIHW 2013), there being no evidence available with which to construct adjustment factors for more recent years. A sensitivity analysis undertaken by the AIHW showed that assuming changes in identification levels between 2011 and 2018 similar to those seen between the two published quality studies would result in negligible impacts on estimates of non-fatal burden derived from these data.
|
State |
Inner Regional |
Major Cities |
Outer Regional |
Remote |
Very Remote |
ALL |
|---|---|---|---|---|---|---|
|
2018 and 2011 |
||||||
|
ACT |
1.69 |
1.69 |
1.69 |
1.69 |
1.69 |
1.69 |
|
NSW |
1.09 |
1.37 |
1.08 |
1.02 |
1.02 |
1.2 |
|
NT |
1 |
1 |
1.03 |
0.99 |
1 |
1 |
|
Qld |
1.12 |
1.17 |
1.04 |
0.97 |
0.97 |
1.08 |
|
SA |
1.03 |
1.16 |
1.03 |
1 |
1 |
1.09 |
|
Tas |
1.37 |
1.37 |
1.37 |
1.37 |
1.37 |
1.37 |
|
Vic |
1.06 |
1.41 |
1.09 |
1.23 |
1.23 |
1.23 |
|
WA |
1.02 |
0.99 |
1 |
1.07 |
1 |
1.01 |
|
Australia |
1.11 |
1.21 |
1.04 |
1 |
1 |
1.09 |
|
2003 |
||||||
|
Australia |
1.11 |
1.25 |
1.06 |
1.03 |
1.03 |
1.12 |
Adjusting for poor quality of Indigenous data
When the quality of Indigenous data was considered to be adequate for reporting in only some jurisdictions and no adjustment factors were available, analysis was restricted to only those jurisdictions with acceptable data quality, and combined rates from these jurisdictions applied to the populations of the remaining jurisdictions to complete the national Indigenous data. Instances where this occurs are detailed in disease-specific methods under relevant diseases.
Indirect methods for deriving Indigenous prevalence
Where no data were available to provide a reliable Indigenous prevalence estimate, indirect methods were needed to derive prevalence estimates. Such methods included applying rate ratios (such as Indigenous-to-non-Indigenous ratio) from proxy data sources (for example, hospitalisations) to the total population prevalence.
Potential indirect methods were assessed against a set of guidelines developed by the AIHW, which covered dimensions relating to the data source used in the indirect method (for example, comparability, relevance and representativeness, currency, accuracy, coverage, statistical uncertainty, measurement error and credibility). This assessment was used in conjunction with expert advice to determine the most appropriate indirect method to derive an Indigenous prevalence estimate for each disease.
Indirect methods were used to derive Indigenous prevalence for either the whole or part of the disease for 61 diseases across 10 disease groups. Of these, 32 (52%) used hospitalisation rate ratios, 28 (46%) used rate ratios from other data sources, and 1 (<0.5%) used Maori prevalence rates. A list of these diseases and sequelae, and the indirect methods used, can be found in the table below.
|
Disease(a) |
Data source and indirect method |
|
Cancer and other neoplasms |
|
|
Non-melanoma skin cancer(b) |
Diagnosis and primary therapy of simple non-melanoma skin cancer: Applied Indigenous-to-national ratio of complex non-melanoma skin cancer |
|
Ductal carcinoma in situ(b) |
Mastectomy due to ductal carcinoma in situ: ratio of Indigenous to national diagnosed breast cancer of less than 2 centimetres applied to national ductal carcinoma in situ incidence |
|
Cardiovascular diseases |
|
|
Atrial fibrillation and flutter |
Applied the New Zealand Maori rates to the Indigenous population to estimate total cases |
|
Gastrointestinal disorders |
|
|
Chronic liver disease |
Liver transplant: Indigenous to non-Indigenous ratios from NHMD. Decompensated cirrhosis: person:separations ratios from NIHSI and age specific ratios from WA. Terminal chronic liver disease: person:separations ratios from NIHSI and age specific ratios from WA. |
|
Infant and congenital conditions |
|
|
Pre-term birth and low birthweight complications(b) |
Neurodevelopment impairment due to pre-term and low birthweight complications: Age-specific rate ratios (Indigenous to non-Indigenous) from IDEA database |
|
Birth trauma and asphyxia |
Age-specific rate ratios (Indigenous to non-Indigenous) from IDEA database |
|
Cerebral palsy |
Sex-specific rate ratios (Indigenous to non-Indigenous) from the Australian Cerebral Palsy Register, age distribution obtained from national estimates |
|
Neural tube defects |
Applied Indigenous birth prevalence rate obtained from WARDA to national estimates |
|
Cardiovascular defects |
Applied Indigenous birth prevalence rate obtained from WARDA to national estimates |
|
Cleft lip and/or palate |
Applied Indigenous birth prevalence rate obtained from WARDA to national estimates |
|
Gastrointestinal malformations(b) |
Acute complications due to gastrointestinal malformations: Applied Indigenous birth prevalence rate obtained from WARDA to national estimates. Incontinence due to anorectal atresia: Sex-specific hospital separation rate ratios (Indigenous to national) |
|
Urogenital malformations |
Applied Indigenous birth prevalence rate obtained from WARDA to national estimates |
|
Down syndrome |
Age-specific rate ratios (Indigenous to non-Indigenous) from IDEA database |
|
Brain malformations |
Age-specific rate ratios (Indigenous to non-Indigenous) from IDEA database |
|
Infectious diseases |
|
|
HIV |
Indigenous proportion derived from Kirby Institute modelling and applied to national estimates |
|
Tuberculosis |
Sex-specific hospital separation rate ratios (Indigenous to national) |
|
Syphilis |
Sex-specific hospital separation rate ratios (Indigenous to national) |
|
Chlamydia |
Sex-specific hospital separation rate ratios (Indigenous to national) |
|
Gonorrhoea |
Sex-specific hospital separation rate ratios (Indigenous to national) |
|
Other sexually transmitted infections(a) |
Sex-specific hospital separation rate ratios (Indigenous to national) |
|
Hepatitis A |
Sex-specific hospital separation rate ratios (Indigenous to national) |
|
Hepatitis B (acute) |
Age- and sex-specific notification rate ratios (Indigenous to national) |
|
Hepatitis C (acute) |
Age- and sex-specific notification rate ratios (Indigenous to national) |
|
Upper respiratory tract infections |
Age- and sex-specific hospital separation rate ratios (Indigenous to national) |
|
Otitis media |
Age- and sex-specific rate ratios (Indigenous to national) of self-reported chronic otitis media in children (AHS 2011–13) |
|
Lower respiratory tract infections |
Age- and sex-specific hospital separation rate ratios (Indigenous to national) |
|
Influenza |
Age- and sex-specific hospital separation rate ratios (Indigenous to national) |
|
Pertussis |
Sex-specific hospital separation rate ratios (Indigenous to national) |
|
Measles |
Sex-specific hospital separation rate ratios (Indigenous to national) |
|
Invasive pneumococcal disease |
Sex-specific hospital separation rate ratios (Indigenous to national) |
|
Meningococcal disease |
Sex-specific hospital separation rate ratios (Indigenous to national) |
|
Other meningitis and encephalitis |
Sex-specific hospital separation rate ratios (Indigenous to national) |
|
Dengue |
Sex-specific hospital separation rate ratios (Indigenous to national) |
|
Ross River virus |
Sex-specific hospital separation rate ratios (Indigenous to national) |
|
Barmah forest virus |
Sex-specific hospital separation rate ratios (Indigenous to national) |
|
Malaria |
Sex-specific hospital separation rate ratios (Indigenous to national) |
|
Campylobacteriosis |
Sex-specific hospital separation rate ratios (Indigenous to national) |
|
Salmonellosis |
Sex-specific hospital separation rate ratios (Indigenous to national) |
|
Rotavirus |
Sex-specific hospital separation rate ratios (Indigenous to national) |
|
Other gastrointestinal infections |
Age- and sex-specific hospital separation rate ratios (Indigenous to national) |
|
Varicella |
Age- and sex-specific hospital separation rate ratios (Indigenous to national) |
|
Herpes zoster (shingles) |
Age- and sex-specific hospital separation rate ratios (Indigenous to national) |
|
Mumps |
Sex-specific hospital separation rate ratios (Indigenous to national) |
|
Urinary tract infections |
Sex-specific hospital separation rate ratios (Indigenous to national) |
|
Mental and substance use disorders |
|
|
Depressive disorders |
Major depressive disorder: Age- and sex-specific rate ratios (Indigenous to national) based on Queensland linked mental health care data Dysthymia: sex-specific rate ratios (Indigenous to national) based on Queensland linked mental health care data |
|
Anxiety disorders |
Age- and sex-specific rate ratios (Indigenous to national) based on Queensland linked mental health care data |
|
Bipolar affective disorder |
Age- and sex-specific rate ratios (Indigenous to national) based on Queensland linked mental health care data |
|
Alcohol use disorders |
Asymptomatic/very mild/mild: Age- and sex-specific hospitalisation rate ratios (Indigenous to national) Moderate/severe: Age- and sex-specific rate ratios (Indigenous to national) based on Queensland linked mental health care data |
|
Drug use disorders |
Cannabis dependence: Age- and sex-specific rate ratios (Indigenous to national) based on Queensland linked mental health care data Amphetamine dependence and opioid dependence: Sex-specific rate ratios (Indigenous to national) based on Queensland linked mental health care data Cocaine dependence: sex-specific rate ratios (Indigenous non-Indigenous) from National Drug Strategy survey data Other drug dependence: sex-specific hospitalisation rate ratios (Indigenous to national) |
|
Schizophrenia |
Age- and sex-specific rate ratios (Indigenous to national) based on Queensland linked mental health care data |
|
Attention deficit hyperactivity disorder |
Average of age-specific rate ratios (Indigenous to non-Indigenous) based on Longitudinal Study of Indigenous Children and Queensland linked mental health care data |
|
Conduct disorder |
Average of age-specific rate ratios (Indigenous to non-Indigenous) based on Longitudinal Study of Indigenous Children and Queensland linked mental health care data |
|
Intellectual disability |
Age-specific rate ratios (Indigenous to non-Indigenous) from IDEA database |
|
Neurological conditions |
|
|
Parkinson disease |
National prevalence rates and severity distribution were applied to the Indigenous population, and adjusted by a ratio based on a New Zealand study |
|
Multiple sclerosis |
National prevalence rates and severity distribution were applied to the Indigenous population, and adjusted by a ratio based on a New Zealand study |
|
Guillain-Barré syndrome |
The national persons-to-separation ratio was applied to the count of Indigenous Guillain‑Barré syndrome hospital separations |
|
Oral disorders |
|
|
Dental caries and pulpitis |
Indigenous-to-national rate ratios from National Survey of Adult Oral Health 2004–06 (15 and over) and Child Dental Health Survey 2009 (less than 15) were applied to national age and sex distributions |
|
Periodontal disease |
Indigenous-to-national rate ratios from National Survey of Adult Oral Health 2004–06 were applied to national age and sex distributions. |
|
Reproductive and maternal conditions |
|
|
Early pregnancy loss |
Indigenous-to-national age-specific rate ratios from hospital separations for medical abortions applied to national rate of Medicare data, in addition to adjusted hospitalisations data |
|
Genital prolapse |
Indigenous-to-national rate ratios from hospital separations for genital prolapse applied to national rate |
|
Skin disorders |
|
|
Ulcers |
Other chronic skin ulcers: hospital rate ratio used to determine prevalence start point, then applied national pattern of prevalence by age and sex Pressure ulcers (skin): hospital rate ratios applied to total population prevalence, by age and sex |
(a) Excludes residual (‘other’) diseases within each disease group, which also used indirect methods such as hospitalisation rate ratios in many instances (6 in total).
(b) Applicable to listed sequelae only.
A further 10 diseases used national prevalence rates to derive Indigenous prevalence for the whole disease, and an additional 10 diseases used national ratios applied to Indigenous hospitalisations or cancer incidence rates to derive Indigenous prevalence for particular sequelae (see table below).
|
Disease |
Data source and indirect method |
|
Cancer and other neoplasms |
|
|
Breast cancer(a) |
Mastectomy due to breast cancer: national incidence-to-hazard ratio applied for males only |
|
Prostate cancer(a) |
Impotence/incontinence due to prostate cancer: national rates of treatments and outcomes for prostate cancer applied to the Indigenous 10-year prevalence of prostate cancer |
|
Laryngeal cancer(a) |
Laryngectomy due to laryngeal cancer: national sex-specific laryngectomy incidence hazard rates applied to the Indigenous 10-year prevalence |
|
Bowel cancer(a) |
Stoma due to bowel cancer: due to the small number of cases and hospitalisations, Indigenous incidence was assumed to be the same as for the national population |
|
Bladder cancer(a) |
Stoma/urinary incontinence due to bladder cancer: insufficient data to produce Indigenous-specific rates for the various urinary diversions, so national rates were assumed. The proportion of people experiencing incontinence due to various diversion types was assumed to be the same for the Indigenous population as the national |
|
Brain and central nervous system cancer(a) |
Brain injury due to brain cancer: national rates assumed |
|
Ductal carcinoma in situ(a) |
Mastectomy due to ductal carcinoma in situ: ratio of Indigenous to national diagnosed breast cancer less than 2cm applied to national ductal carcinoma in situ incidence |
|
Benign and uncertain brain tumours(a) |
Brain injury due to benign and uncertain brain tumours: national rates assumed |
|
Endocrine disorders |
|
|
Type 1 diabetes mellitus |
National age- and sex-specific rates applied in people aged 30 and over |
|
Gastrointestinal disorders |
|
|
Inflammatory bowel disease |
Assumed same prevalence rate as national |
|
Gastro-oesophageal reflux disease |
Assumed same prevalence rate as national |
|
Functional gastrointestinal disorders |
Assumed same prevalence rate as national |
|
Mental and substance use disorders |
|
|
Eating disorders |
Assumed same prevalence rate as national |
|
Autism spectrum disorders |
Assumed same prevalence rate as national |
|
Reproductive and maternal conditions |
|
|
Endometriosis |
Assumed same prevalence as total Australian population for endometriosis. Adjusted hospital separations used for severe endometriosis and subtracted from total endometriosis estimates to inform mild estimates |
|
Infertility |
Assumed same prevalence rate as total Australian population for Infertility (including all sequelae of the infertility envelope) |
|
Other reproductive conditions |
Assumed same prevalence as total Australian population for other reproductive conditions. |
|
Polycystic ovarian syndrome |
Assumed same prevalence as total Australian population for polycystic ovarian syndrome. |
|
Skin disorders |
|
|
Acne |
Assumed same prevalence rate as national |
|
Dermatitis and eczema |
Assumed same prevalence rate as national |
Severity distributions
The overall prevalence of a sequela that maps to more than one health state was distributed across those health states using Australian empirical data or epidemiological studies, where possible. The proportion of prevalent cases in each health state at a point in time is referred to as the severity distribution for the sequelae in question.
Where there were no empirical data on the distribution of health states within a sequela, severity distributions were adopted from the NZBDS or the GBD 2013 (where used in the ABDS 2011), GBD 2015 or GBD 2017, where available. Severity distributions from the GBD were considered global distributions, however they were generally derived from data from developed countries (predominantly the United States of America and/or Australia), and so were considered appropriate to the Australian context.
Modelling practices
Modelling of point prevalence from epidemiological measures—such as period prevalence or incidence—required different approaches, depending on the type of condition being modelled and the nature of the data available. For consistency across the ABDS, the following practices were applied in the circumstances described.
Acute versus chronic sequelae
For chronic conditions or conditions that last for at least 1 year, point prevalence is equal to annual prevalence. Prevalent age (the age associated with the disease case, which is carried into YLD calculations) is the person’s age in the reference year.
For sequelae with short duration (such as appendicitis), acute events within a chronic disease (such as acute coronary syndrome) and the acute phase of injuries, point prevalence must take into account the duration of the health loss. Where health loss is less than 1 year, point prevalence is numerically equal to incidence multiplied by duration, where duration is expressed as a fraction of a year. As duration is less than 1 year, the prevalent age at which health loss occurs is the same as the incident age.
Episodic diseases
Episodic diseases are characterised by relapse and quiescent phases.
Where the quiescent phase remained as background health loss during an acute phase (for example, chronic pancreatitis during an episode of acute pancreatitis), the phases were treated as separate sequelae, and the prevalence of the quiescent phase was assigned for the whole year.
The prevalence of the acute phase was estimated using the same approach as for acute conditions. The combined health loss of co-existing sequelae was adjusted for in the comorbidity bias adjustment (described in ‘Dealing with comorbidity’).
Where the quiescent phase was not evident during an acute phase (for example, migraine), the phases were treated as severity levels, and the prevalence distributed according to the frequency and duration of the relapse using the same approach as for acute sequelae.
Progressive diseases
Progressive diseases are characterised by disease progression through various phases.
Where these phases generally lasted less than 1 year and could not co-exist (such as the progression through cancer from diagnosis, metastases and terminal phase), these were treated as severity levels, and prevalence was distributed according to the duration of the phase.
Where the progressive phases could co-exist (such as amputation due to diabetes), these were generally treated as separate sequelae, and estimated separately. The combined health loss of co-existing sequelae was adjusted for in the comorbidity bias adjustment.
Data transformation
Where data sources used a different case definition, or a period prevalence (for example, 1‑month and 6-month prevalence), the data needed to be adjusted to be consistent, which was done using expert advice. Details of such adjustments are included in the relevant disease-specific methods section.
Estimating the total prevalence of conditions that are sequela to many diseases
There were a small number of conditions (heart failure, vision loss, anaemia, infertility, intellectual disability and cerebral palsy) that were sequelae of many different diseases. For each of these conditions, the combined prevalence of the different sequelae must equal the total prevalence of the condition present in the population.
For example, anaemia is a sequela of iron-deficiency anaemia, haemolytic anaemia, uterine fibroids, chronic kidney disease, gastroduodenal disorders and maternal haemorrhage. If the prevalence of anaemia due to each of these diseases were estimated independent of each other, there is a risk of either under-estimating the total prevalence of anaemia (as there might be a source of anaemia not counted), or over-estimating the total health loss as the combined prevalence may exceed the total anaemia present in the population.
To overcome this problem, the total anaemia present in the population was treated as fixed (referred to as an ‘envelope’), and the individual prevalence of anaemia due to each of these diseases adjusted to ensure they summed to the overall prevalence (please see Disease-specific methods for more detail).
Envelopes were used for heart failure, vision loss, anaemia, infertility, intellectual disability and cerebral palsy. The details of prevalence estimation and the methods for adjustment for each envelope are described in disease-specific methods.
Dealing with comorbidity
Comorbidity occurs when a person experiences several diseases or injuries simultaneously. This might arise by coincidence (known as independent comorbidity), such as when someone has both asthma and dental caries. Or it might reflect systematic influences, such as when: a single risk factor (for example, an environmental pollutant or physical inactivity) gives rise to several health conditions; multiple conditions are associated genetically; or when one condition (or its treatment) gives rise to another condition. The clinical and epidemiological literature offers multiple views, causal pathways and taxonomies of comorbidity.
Comorbidity is of interest in its own right. The preferred clinical treatment of a person experiencing comorbidity might not be just the simultaneous application of treatments for the co‑conditions. An understanding of comorbidity might be important to assess and ameliorate risk factors. Patterns of comorbidity may differ markedly between subpopulations of interest (for example, between young and old, Indigenous and non-Indigenous, urban and rural) and such differences affect health policies, programs and practice.
Comorbidity in burden of disease studies
Accounting for comorbidity is an important process in the non-fatal estimation component of burden of disease studies. To estimate burden inclusive of comorbidity, we would need both a full suite of:
- unit records for every person in the population, showing what combination of (comorbid) conditions that person experienced in the reference period
-
disability weights associated with every observed combination of comorbid conditions.
Whist this would enable estimation of population level YLD that accounts for all possible combinations of morbidity, it would not be able to provide comorbidity adjusted YLD for an individual disease.
As comprehensive unit-record level comorbidity data and a full suite of combination disability weights does not exist, available prevalence data for each consequence of disease and derived disability weights are used. The available data are less than ideal, because:
- prevalence is derived from a wide variety of data sources and models, is generally restricted to a single health condition, not combinations of conditions, and there is no data on the pattern of all possible comorbidities
-
available suites of disability weights refer to single health conditions, rather than all possible combinations of conditions.
In addition, it is implausible to assume that disability weights are additive:
- Consider the case of Jane Doe who has metastatic cancer (disability weight = 0.451), episodic migraine headache (disability weight = 0.441) and severe epilepsy (disability weight = 0.552). If we ignore comorbidity, Jane would contribute 1.444 person-years to aggregate YLD, which exceeds the ceiling of 1 person-year (per individual) of non-fatal health loss on any individual’s contribution.
As a result, the total of the (unadjusted) condition-by-condition estimates of YLDs created using the available prevalence and disability weights will not coincide with the ideal aggregate YLD described above. This discrepancy is termed ‘comorbidity bias’ and must be adjusted for.
In the absence of comprehensive data sets, adjusting for comorbidity bias in burden of disease estimation has relied on modelling both the prevalence and the disability weights for comorbid conditions. The modelled data are then used to compute a rescaled (comorbidity-adjusted) disability weight for each individual disease—and it is from these adjusted weights (applied to the original prevalence) that comorbidity-adjusted YLD are derived.
Comorbidity bias adjustment in the ABDS 2018
The strategy outlined above has been adopted for the ABDS 2018. The key idea underpinning the adjustment procedure was to simulate a population with comorbidities and their associated health losses (disability weights) that mimics the ideal data set hypothesised earlier, to support the compilation of comorbidity-adjusted disability weights.
-
For prevalence, the ABDS 2018 assumed independent (‘multiplicative’) comorbidity—that is, the probability of having a specific combination of conditions is simply the product of the probability of having each of the constituent conditions. In reality, the pattern of comorbidities is likely to be more complex, but there is evidence that this assumption provides an approximation acceptable for the purposes of burden of disease estimation (Vos et al. 2012).
-
For disability weights, the ABDS 2018 assumed a multiplicative relationship between the health loss suffered by a person with specific combinations of sequelae and the losses associated with the constituent sequelae. The combined disability weight for a comorbid combination of conditions is equal to:
-
1 minus {the product of {1 minus the disability weight for each constituent sequela}}.
This assumption puts a maximum value of 1 on the disability weight that can arise from any combination of conditions.
-
Assumptions of these kind have been used in recent iterations of the GBD studies and other burden of disease studies.
Because disease prevalence are known to vary by age and sex (and to support results to be broken down), the procedure was undertaken at the sequela level for each age and sex. To account for known differences in disease prevalence in the Australian population at points in time, comorbidity bias adjustment was undertaken separately for each of the reference years—2003, 2011, 2015 and 2018—using the prevalence specific to those years.
Assembling the simulated population entailed the following steps:
-
The available data on single-condition prevalence (and the independence assumption) were used to simulate a population that shows all possible combinations of 1, 2, 3 or 4 comorbid conditions selected from the ABDS 2018 list of sequelae. The frequency of a given combination within the simulated population depends on the probabilities (taken as the per-capita prevalence) of individual conditions. In reality, a person may experience 5 or more conditions, but the approximation error from capping the number of conditions in the synthetic population at 4 is negligible. The probability (expected prevalence) associated with a combination of conditions shrinks rapidly toward 0 as the number of co‑present sequelae increases. For example, the impact of any change on the calculated YLD of the fifth co‑present sequelae is minimal, because the comorbidity-bias-adjusted disability weight is stable to the fifth decimal point. Any change in the fifth decimal place will only affect the YLD calculated for prevalence estimates greater than 100,000 in a particular age–sex cohort.
-
The available data on single-condition disability weights (and the multiplicative assumption) was used to attach an adjusted disability weight to each combination of comorbid conditions, and, from there, to each population age and sex group.
The adjusted YLD that result from applying adjusted disability weights derived from the simulation are expected to be a reasonable approximation to the ideal aggregate YLD (and comorbidity-adjusted YLD for individual conditions) described earlier. The closeness of the approximation and whether an adjusted YLD has over-compensated or under-compensated for comorbidity bias depends on the assumptions regarding independence. Validation studies by the GBD and the New Zealand Ministry of Health suggest that the approximations using a multiplicative model appear reasonable at aggregate level (NZMOH 2012, Vos et al. 2012). Further validation or improvement of the methods await the availability of richer data sets.
Estimating YLD for residual diseases
Where possible, the prevalence of the residual group of diseases within each disease group (for example, other malignant neoplasms) was estimated or modelled directly from data.
Where this was not possible, either due to the variety of conditions that it encompassed, or through lack of available data, the YLD for the residual diseases was calculated using the YLL-to-YLD ratio estimated for other conditions in that disease group (at the age and sex level) applied to known YLL. The YLL-to-YLD ratio was limited to those conditions in the disease group that were similar in nature to those included in the residual.
This method was used to generate estimates for other cardiovascular, endocrine, gastrointestinal, infectious, congenital, kidney, neurological and respiratory diseases.
Further information on the diseases included in the YLL-to-YLD ratio for each disease group is included in disease-specific methods.
AIHW 2013. Residential and community aged care supplementary data. Canberra: AIHW. Viewed 19 May 2015.
GBD (Global Burden of Disease Study) 2013 Collaborators 2015. Supplement to: Global, regional, and national incidence, prevalence, and years lived with disability for 301 acute and chronic diseases and injuries in 188 countries, 1990–2013: a systematic analysis for the Global Burden of Disease Study 2013. The Lancet 386(10010): S1–1868.
NZMOH (New Zealand Ministry of Health) 2012. Ways and means: a report on methodology from the New Zealand Burden of Diseases, Injuries and Risk Factors Study, 2000–2016. Wellington: NZMOH.
Salomon J 2010. New disability weights for the global burden of disease. Bulletin of the World Health Organization 88:879.
Salomon JA, Vos T, Hogan DR, Gagnon M, Naghavi M, Mokdad A et al. 2012. Common values in assessing health outcomes from disease and injury: disability weights measurement study for the Global Burden of Disease Study 2010. The Lancet 15, 380(9859):2129–43.
Vos T, Flaxman AD, Naghavi M, Lozano R, Michaud C, Ezzati M et al. 2012. Years lived with disability (YLDs) for 1160 sequelae of 289 diseases and injuries 1990–2010: a systematic analysis for the Global Burden of Disease Study 2010. Lancet 380:2163–96.