Breast cancer screening activity
On this page:
For BreastScreen Australia, activity data are available on the number of screening mammograms performed in a specified period.
Explore the latest data in the visualisation below.
Screening mammograms performed
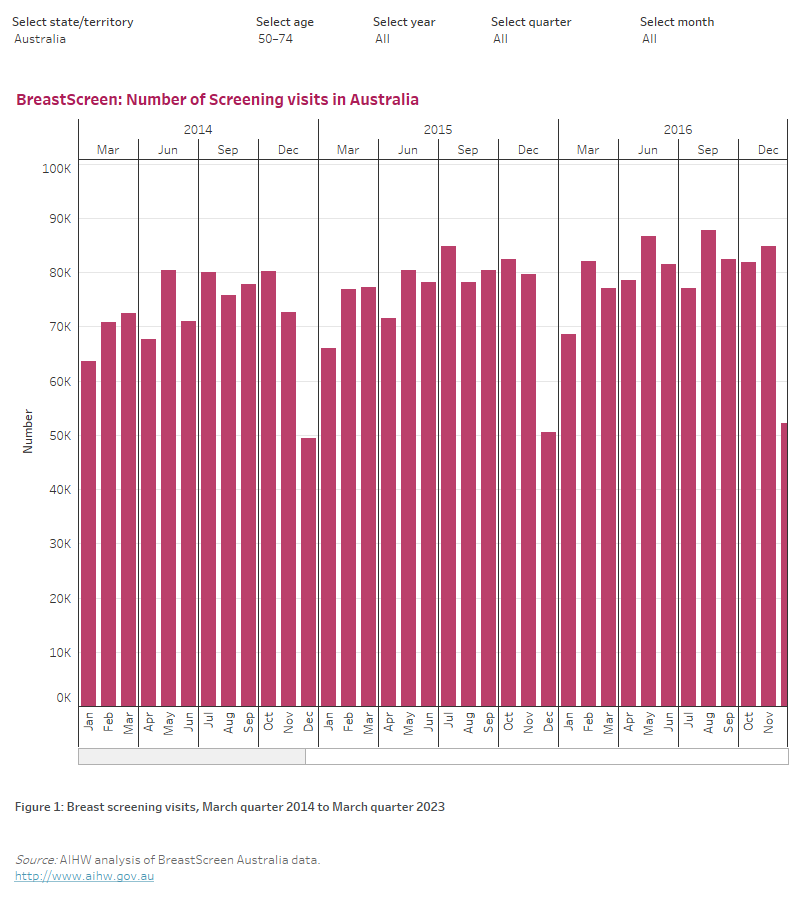
In the March quarter 2023, 259,000 screening mammograms were performed for women aged 50–74.
Trends in breast screening activity
Between the March quarter 2014 and the March quarter 2023:
- BreastScreen Australia program activity among women aged 50–74 steadily increased from 862,000 screening mammograms performed in 2014 (first full year of available data) to 976,000 screening mammograms performed in 2019 but fell over 2020 and 2021 to 839,000 and 924,000 screening mammograms performed, respectively. In 2022, the number of screening mammograms has slightly increased to 945,000.
September quarters have consistently had the highest number of screening mammograms performed, followed by June, March and December quarters.
The only exceptions to this occurred in the June quarter 2020 and September quarter 2021 which had the lowest number of screening mammograms performed in any quarter of 2020 and 2021.This aligns with the effects of COVID-19 on program delivery as described below.
- In the December quarters 2019 and 2021, less screening mammograms were performed (226,000 and 214,000, respectively).
- December quarter 2022 recorded activity levels similar to the December quarters in 2020 and 2018 with 231,000 screening mammograms performed.
- During the March quarter 2023 the number of screening mammograms was higher than during the March quarters of the preceding 3 years.
Impact of the COVID-19 pandemic on breast cancer screening
- As a result of COVID-19 restrictions, BreastScreen Australia services were temporarily suspended from late March to late April/early May 2020, directly impacting BreastScreen Australia operations.
- For instance, screening mammograms for women aged 50–74 in the June 2020 quarter (110,000) were the lowest observed between 2014 to present.
- Following the June quarter 2020, quarterly screening mammograms returned to relative normalcy when compared to the same quarter across other years.
- In 2021, screening mammograms for women aged 50–74 increased to pre-COVID levels in the first half of the year (499,000 in 2021 vs 492,000 in 2019) before again falling in the second half of the year (425,000 in 2021 vs 484,000 in 2019 and 495,000 in 2020).
- It is unclear whether ongoing restrictions and/or concern over COVID-19 or seasonal factors, such as regional weather events etc., or their combination is responsible for the relative drop in monthly screening tests observed in the second half of 2021.
- In 2022, the overall number of mammograms rose slightly from 924,000 in 2021 to over 945,000 in 2022, most of the COVID-19 restrictions were lifted progressively as almost all the Australian population became fully vaccinated.
- In the first quarter 2023, the number of screening mammograms has exceeded the number of screening mammograms performed during the first quarter 2019 before the commencement of the COVID-19 pandemic (259,000 in the March quarter 2023 and 244,000 in the March quarter 2019).
For more information about the impact of COVID-19 on Australia’s cancer screening programs, see AIHW Cancer screening page and the AIHW report Cancer screening and COVID-19 in Australia.
This data visualisation shows monthly national activity data for BreastScreen Australia from March 2014 to March 2023. The column graph shows the number of mammograms returned by year and can be filtered by year, quarter, month, state/territory and age. The second tab shows the activity data in table form, and can be filtered by measure, by year, by quarter, by month, by age and by state and territory.

References
AIHW (Australian Institute of Health and Welfare) (2021) Cancer screening and COVID-19 in Australia, catalogue number CAN 137, AIHW, Australian Government, accessed 6 December 2022.
AIHW (2022) Cancer screening - Australian Institute of Health and Welfare (aihw.gov.au) accessed 6 December 2022.


