Cervical screening participation
On this page:
For the National Cervical Screening Program (NCSP), participation refers to the proportion of people aged 25–74 who screened in a 5-year period.
From 1 December 2017, the NCSP changed to 5-yearly cervical screening for those aged 25–74. Participation is therefore measured over 5 calendar years to align with the recommended screening interval.
Explore the latest data in the visualisation below.
Participation in cervical screening
Preliminary participation data for the 5-year cervical screening round is available for the first time since the program's roll-out in December 2017. These data are from January 2018 to December 2022. Prior to this, only interim data was available for estimates to be calculated.
According to the 2018–2022 preliminary data:
- Almost 4.7 million people aged 25–74 who were eligible for cervical screening participated in the NCSP.
- The national participation rate was 68% of the eligible population.
Participation by age
According to the 2018–2022 preliminary data:
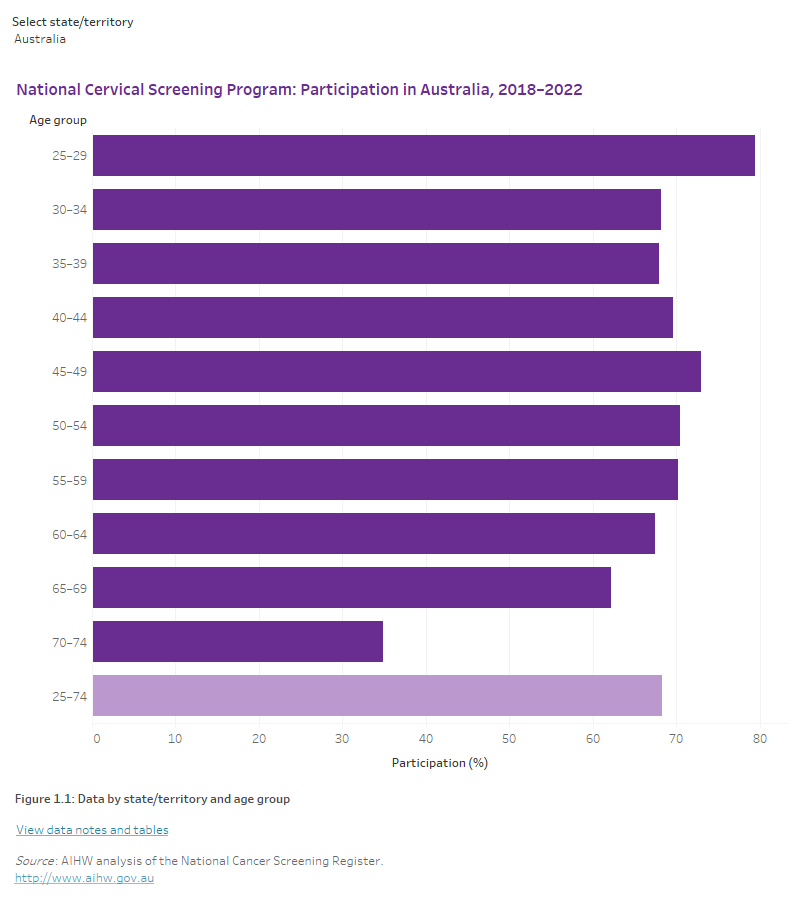
- People aged 25–29 had the highest participation rate (79%).
- People aged 70–74 had the lowest estimated participation rate (35%).
Note that lower participation rates are expected among people aged 70–74 as they have re-entered the target age group under the renewed NCSP after having left the previous program after age 69.
Participation by state/territory
According to the 2018–2022 preliminary data:
- The estimated participation rate among people aged 25–74 was the highest in the Australian Capital Territory (71%).
- After adjusting for difference in population age structure across the states and territories, the age-standardised participation rate in the Australian Capital Territory was 1.04 times higher than the national participation rate (71% and 68% respectively) with a difference of 3 percentage points between the two rates.
Figure 1: National Cervical Screening Program participation data, by age group and by state and territory, 2018–2022
This data visualisation shows participation data for the National Cervical Screening Program for 2018 and 2018–2022. The bar graph shows participation by age group and can be filtered by state/territory and year. A second tab second shows participation rate for Australia and the states and territories for people aged 25–74 filtered by rate type: crude or age-standardised rate. A third tab shows the participation data in a table form and can be filtered by measure and by state and territory.

Geographical variation in cervical screening participation
Exploring participation across different geographical areas can help to identify where resources are needed to improve equity, accessibility, and participation in cancer screening programs and can inform strategies to improve screening rates among defined target groups.
Explore the latest geographical data in the visualisations below.
Participation by Primary Health Networks
Primary Health Network areas (PHNs) consist of 31 health regions across Australia whose purpose is the improvement of population health outcomes and regional coordination of health services in Australia (DHAC 2022).
According to the 2018–2021 interim data:
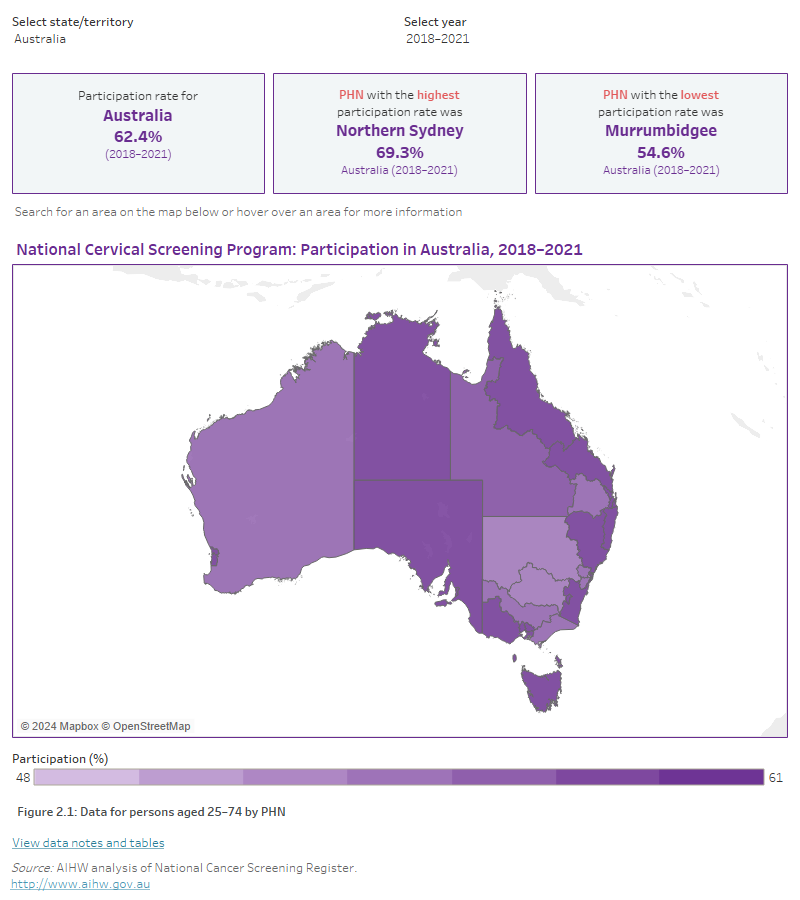
- Northern Sydney (New South Wales) had the highest estimated participation rate among PHN areas (69%).
- Murrumbidgee (New South Wales) had the lowest estimated participation rate (55%).
Figure 2: National Cervical Screening Program participation rates for persons aged 25–74 by PHN
This data visualisation shows participation data for the National Cervical Screening Program by Primary Health Network. The map can be filtered by state/territory and by year. It uses shaded areas of colour to show participation rates. The bar graph on the second tab can be filtered by age group and by year and shows the participation rate of each Primary Health Network for the selected period. The third tab shows the participation data by Primary Health Network in table form and can be filtered by measure (number of participants, eligible population and participation rate), by state/territory and by age group.

Participation by Statistical Area Level 3
Statistical Areas Level 3 (SA3s) consist of 333 geographical areas of Australia from the Australian Statistical Geographical Structure (ASGS), defined by the Australian Bureau of Statistics (ABS) (ABS 2021).
According to the 2018–2021 interim data:
- Manly (New South Wales) had the highest participation rate among SA3 areas (78%).
- Lord Howe Island (New South Wales) had the lowest participation rate (44%).
Figure 3: National Cervical Screening Program participation rates for persons aged 25–74 by SA3
This data visualisation shows participation data for the National Cervical Screening Program by Statistical Area Level 3. The map can be filtered by state/territory, by year and by age group, and uses shaded areas of colour to show participation rates. The bar graph on the second tab can be filtered by state/territory, by age group and by year and shows the participation rate of each Statistical Area Level 3 for the selected period. The third tab shows the participation data by Statistical Area Level 3 in table form and can be filtered by measure (number of participants, eligible population and participation rate), by state/territory and by age group.

References
ABS (Australian Bureau of Statistics) (2021) Australian Statistical Geography Standard (ASGS): Volume 3 – Main Structure and Greater Capital City Statistical Areas – Statistical Area Level 3, July 2021, catalogue number 1270.0.55.003, ABS, Australian Government, accessed 6 December 2022.
DHAC (Department of Health and Aged Care) (2022) Primary Health Networks (PHNs), Health website, accessed 6 December 2022.


