Bowel cancer screening participation
On this page:
For the National Bowel Cancer Screening Program (NBCSP), participation refers to the proportion of people invited who returned a completed screening test during a specified period.
Participation in the NBCSP is measured over 2 calendar years to align with the 2-year recommended screening interval. Participation rates are calculated using an additional 6 months of data after the end of the 2-year invitation period, to allow time for all invitees to complete and return their screening kit. Participation rates in this section are preliminary and these rates are presented to one decimal place in this release.
These data are sourced from live databases that are updated over time and may differ from other AIHW cancer screening reports where the data are sourced at a different time.
Explore the latest data in the visualisation below.
Participation in bowel cancer screening
In 2020–2021:
- Almost 6.1 million people aged 50–74 were invited to participate in the NBCSP.
- Almost 2.5 million people returned a completed bowel screening test.
- The national participation rate was 40.9%.
Participation by sex and age
In 2020–2021:
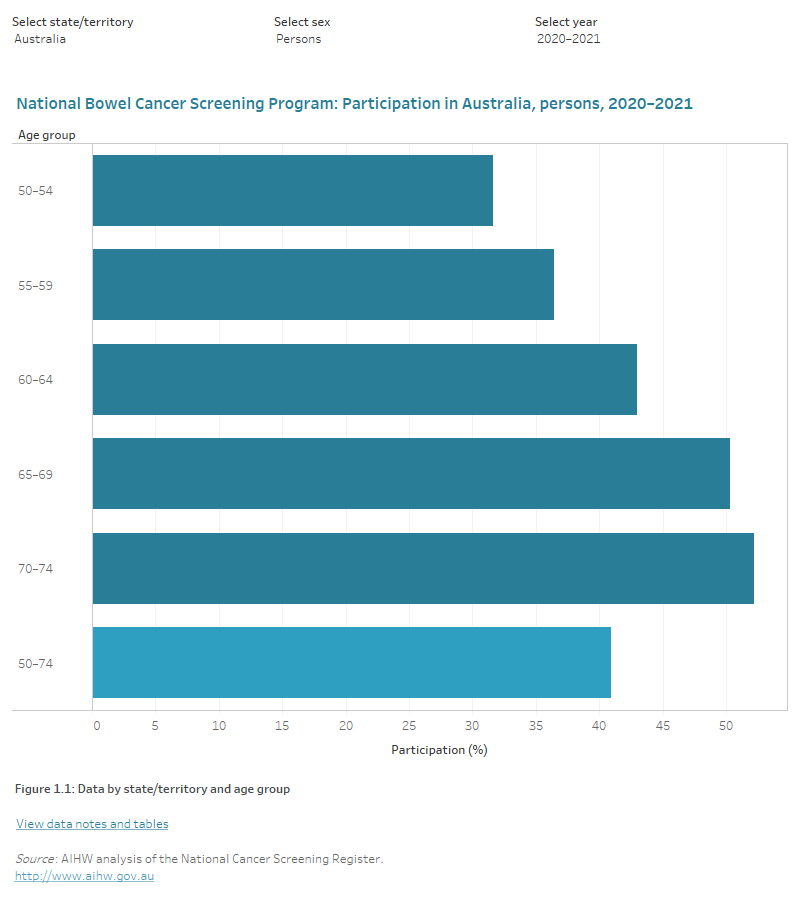
- Women had a higher participation rate than men (42.8% compared with 38.9%).
- Those aged 70–74 years had the highest participation rate (52.2%).
- Those aged 50–54 years had the lowest participation rate (31.6%).
Trends in bowel cancer screening participation
Between 2014–2015 and 2020–2021:
- The national participation rate has increased from 38.9% of invited people aged 50–74 in 2014–2015 to 43.8% in 2019–2020.
- The participation rate has dropped from 43.8% in 2019–2020 to 40.9% in 2020–2021. It is still unclear why this drop has occurred.
Since 2018 the program has widened its target ages resulting in a steady increase in the number of invitees over time (See the National Bowel Cancer Screening Program age groups invited by year section of the Technical notes for more information).
Participation by state/territory
In 2020–2021:
- Both South Australia and Tasmania had the highest bowel screening participation rates for people aged 50–74 (44.4%).
Figure 1: National Bowel Cancer Screening Program participation data, by sex, by age group, by state and territory and by year
This data visualisation shows final participation data for the National Bowel Cancer Screening Program from 2014–2015 to 2020–2021. The bar graph shows participation by age group and can be filtered by state/territory, sex (males/females and persons) and year. The line graph found on the second tab shows trend data by type of measure (number of invitees, number of participants, and participation rate), state/territory, sex and age group. A third tab shows the participation data in a table form and can be filtered by measure and by state and territory.

Geographical variation in bowel cancer screening participation
Exploring participation across different geographical areas can help to identify where resources are needed to improve equity, accessibility and participation in cancer screening programs and can inform strategies to improve screening rates among defined target groups.
Explore the latest geographical data in the visualisations below.
Participation by Primary Health Networks
Primary Health Network areas (PHNs) consist of 31 health regions across Australia whose purpose is the improvement of population health outcomes and regional coordination of health services in Australia (DHAC 2022).
In 2020–2021:
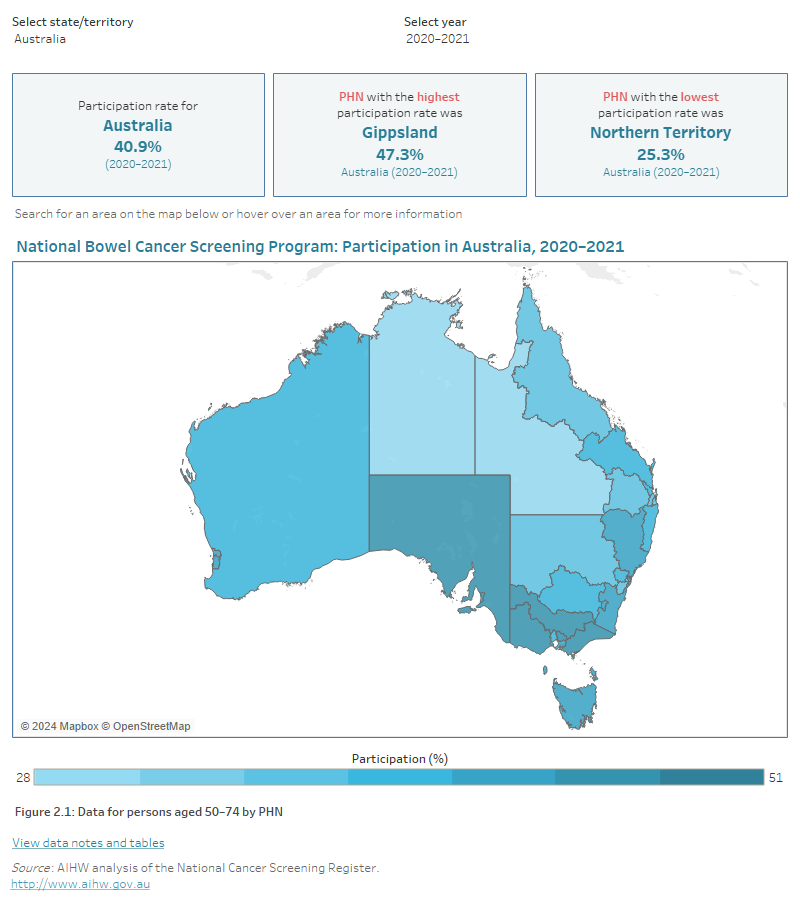
- Gippsland had the highest participation rate among PHN areas (47.3%).
- The Northern Territory had the lowest participation rate (25.3%).
Figure 2: National Bowel Cancer Screening Program participation rates for persons aged 50–74 by PHN
This data visualisation shows final participation data for the National Bowel Cancer Screening Program by Primary Health Network between 2014–2015 and 2020–2021. The map can be filtered by state/territory and year and uses shaded areas of colour to show participation rates. The bar graph on the second tab can be filtered by year and shows the participation rate of each Primary Health Network for the selected period. A third tab shows the participation data by Primary Health Network in table form and can be filtered by measure (number of invitees, number of participants and participation rate) and by state and territory and by year.

Participation by Statistical Area Level 3
Statistical Areas Level 3 (SA3s) consist of 333 geographical areas of Australia, defined by the Australian Bureau of Statistics (ABS) as part of the Australian Statistical Geographical Structure (ASGS) (ABS 2021).
In 2020–2021:
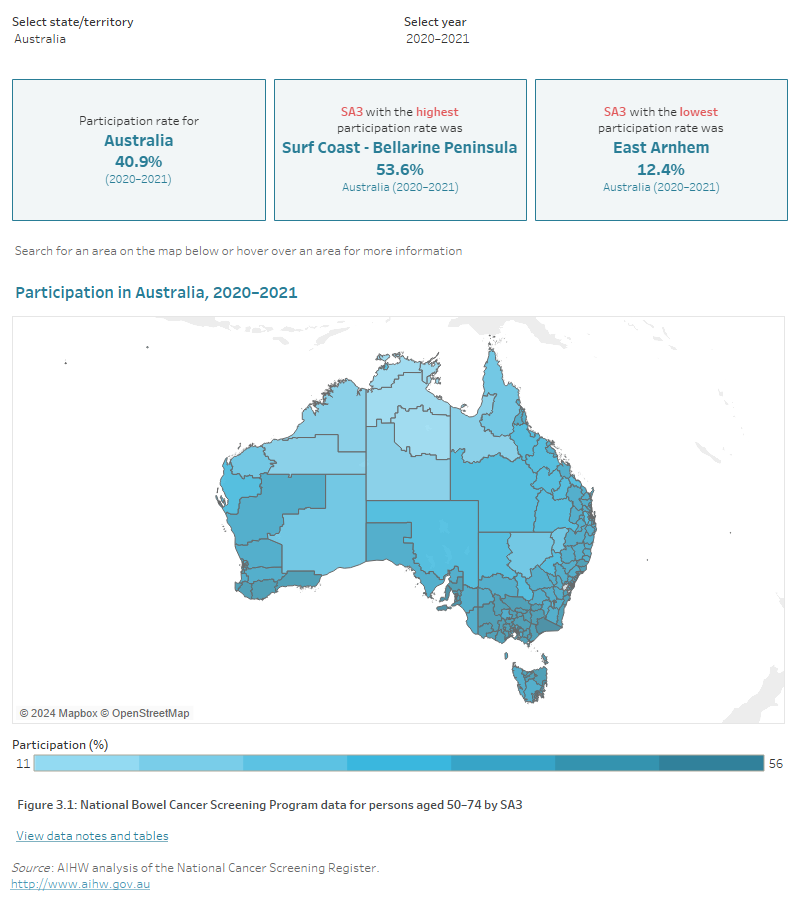
- Surf Coast – Belarine Peninsula had the highest participation rate among SA3s (53.6%).
- East Arnhem had the lowest participation rate (12.4%).
Figure 3: National Bowel Cancer Screening Program participation rates for persons aged 50–74 by SA3
This data visualisation shows participation data for the National Bowel Cancer Screening Program by Statistical Area Level 3. The map can be filtered by state/territory and year and uses shaded areas of colour to show participation rates using final data from 2014–2015 to 2020–2021. The bar graph on the second tab can be filtered by state/territory and year and shows the participation rate of each Statistical Area Level 3 for the selected period. A third tab shows the participation data by Statistical Area Level 3 in a table form and can be filtered by measure (number of invitees, number of participants and participation rate), by state and territory and by year.

References
ABS (Australian Bureau of Statistics) (2021) Australian Statistical Geography Standard (ASGS): Volume 3 — Main Structure and Greater Capital City Statistical Areas – Statistical Area Level 3, July 2021, catalogue number 1270.0.55.003, ABS, Australian Government, accessed 6 December 2022.
DHAC (Department of Health and Aged Care) (2022) Primary Health Networks (PHNs), Health website, accessed 6 December 2022.


