The process of determining child maltreatment
On this page
Key findings
In 2021–22,
- 275,000 children were subjects of notifications of alleged maltreatment.
- 119,000 children became subjects of investigations.
- 45,500 children in finalised investigations were subjects of substantiations of maltreatment.
Notifications, investigations, and substantiations are the entry point for children into the child protection system. These components are sequential:
- An initial notification of alleged child maltreatment is made to a child protection department.
- If the notification meets the threshold for further action, an investigation of the alleged maltreatment is conducted.
- The investigation ends with a substantiation decision about whether there is reasonable cause to believe that a child has been, is being, or is at risk or significant risk of being, maltreated.
Refer to the Appendices for more information on the notifications, investigations, and substantiations components of the child protection system.
The data in this section relate to children for whom notifications were made about them to child protection departments between 1 July 2021 and 30 June 2022.
Due to differences in the way jurisdictions collect and report on notifications, investigations and substantiations, data are not comparable between jurisdictions. Refer to the Appendices for more information on differences in jurisdictions’ policy and practice.
How many children were subjects of notifications and investigations?
In 2021–22, 275,000 children were subjects of notifications (49 per 1,000) (see: Supplementary data table T1).
The most common sources of notifications were:
- school personnel (25% or 67,600)
- police (24% or 65,200)
- medical or health personnel (11% or 29,900).
Source: Unpublished data from the AIHW Child Protection Collection
The child protection collection contains more than one notification where it relates to different events of alleged maltreatment, or a different person believed responsible. Of children who were subjects of notifications:
- about two-thirds (67% or 185,000) had a notification made about them for one event of alleged child maltreatment
- about one-third (33% or 89,800) were subjects of 2 or more notifications for different events of alleged child maltreatment.
Source: Unpublished data from the AIHW Child Protection Collection
In 2021–22, more than half (55% or 152,000) of children were assessed as having low risk of harm and therefore notifications made about them were resolved without an investigation. Of these:
- more than half (55% or 83,100) did not require further action as they were not at risk of potential or actual harm
- about one-third (33% or 50,000) were provided with advice or referred to other services
- about 13% (19,300) required other intervention, for example, in cases where children were assessed as low risk but still in need.
Source: Unpublished data from the AIHW Child Protection Collection
About 43% (119,000) of children for whom notifications were made about them became subjects of investigations. Of these:
- the majority (85% or 101,000) had a finalised investigation with an outcome of either substantiated (45% or 45,500) or not substantiated (55% or 55,300)
- about 10% (12,200) had an investigation in process
- about 5% (6,000) had an investigation closed with no outcome possible, for example, in cases where families have relocated.
Source: Supplementary data table S3.3
In 2021–22, about 1,300 children were awaiting an assessment decision on whether to undertake an investigation.
Source: Unpublished data from the AIHW Child Protection Collection
How many children were subjects of substantiated maltreatment?
In 2021–22, about 45% (45,500) of children in finalised investigations were subjects of substantiations of maltreatment (see: Supplementary data table S3.3). Of these:
- 13,600 were Aboriginal and Torres Strait Islander children (40 per 1,000 Indigenous children)
- 30,500 were non-Indigenous children (5.7 per 1,000 non-Indigenous children).
Source: Supplementary data table S3.9
The higher rate of Indigenous children in child protection substantiations is complex, and may have been affected by:
- the legacy of past policies of forced removal
- intergenerational effects of previous separations from family and culture
- a higher likelihood of living in the lowest socioeconomic areas
- perceptions arising from cultural differences in child-rearing (HREOC 1997).
More information on Indigenous children will be included in the report over the coming months.
Characteristics of children with substantiated maltreatment
For children who were subjects of substantiations:
- about 81% (36,900) had only one substantiation (see: Supplementary data table S3.4)
- about 51% (23,000) were girls and about 47% (21,600) were boys (see: Supplementary data table S3.5)
- emotional abuse was the most common type of maltreatment (57% or 25,900), followed by neglect (21% or 9,400) (see: Supplementary data table S3.5)
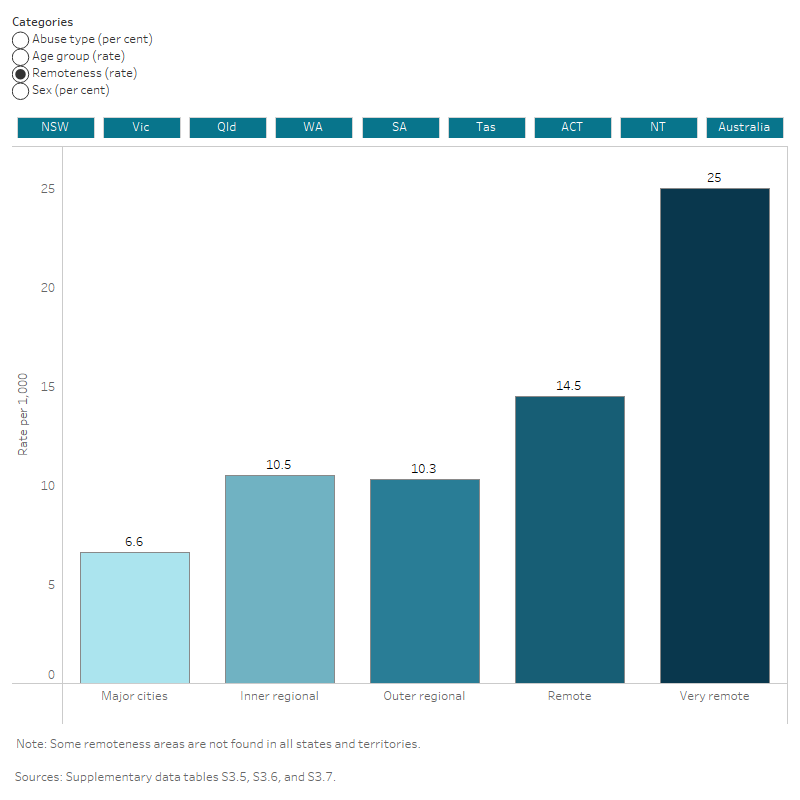
- children living in very remote areas (25 per 1,000) were almost 4 times more likely to be maltreated than children living in major cities (6.6 per 1,000) (see: Supplementary data table S3.7)
- about one-third (33% or 15,100) were from the lowest socioeconomic areas (see: Supplementary data table S3.8)
- infants aged under one were more likely to be maltreated than any other age group (15 per 1,000) (see: Supplementary data table S3.13).
Figure 1: Characteristics of children with substantiated maltreatment, by state or territory, 2021–22
This interactive data visualisation shows the number of children with substantiated maltreatment disaggregated by abuse type, age group, remoteness, and sex in the year 2021–22. Data are displayed for each state or territory and Australia.

Has the number of children in the system changed over time?
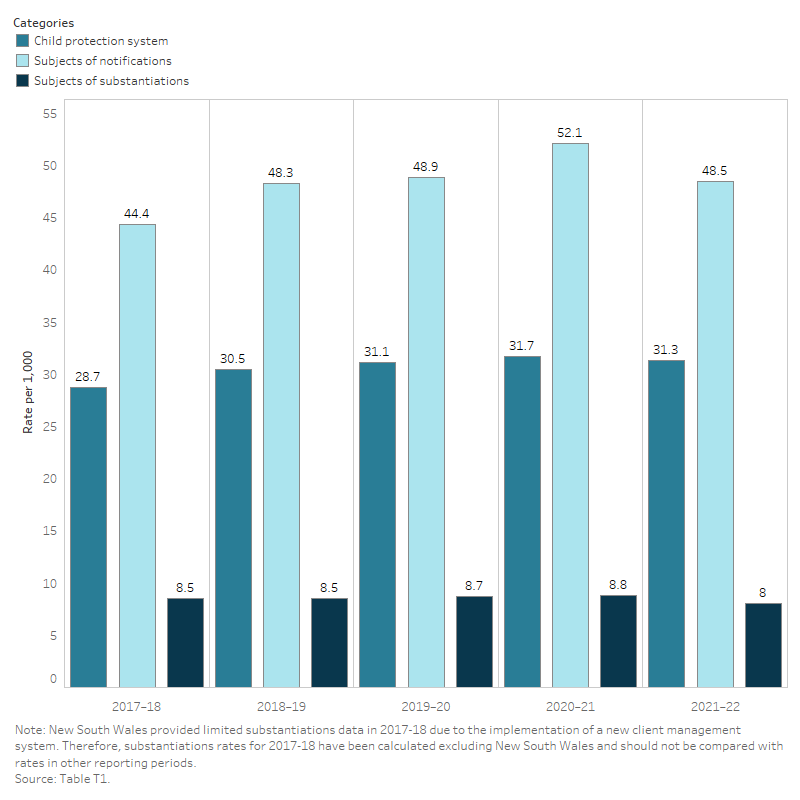
From 2017–18 to 2021–22, the rate of children who were:
- in the child protection system increased from 29 per 1,000 to 31 per 1,000
- subjects of notifications increased from 44 per 1,000 to 49 per 1,000
- subjects of substantiations remained relatively stable from 8.5 per 1,000 to 8.0 per 1,000.
Source: Supplementary data table T1
While notifications increased, the rates for substantiations remained steady across these timeframes. This could be a result of:
- legislative changes, such as the expansion of the list of occupations that is mandated to report cases of suspected child maltreatment
- increased public awareness from inquiries into child protection processes.
Refer to the Appendices for more information on legislative changes and various inquiries into the child protection system.
Figure 2: Number of children in different components of child protection, 2017–18 to 2021–22
This interactive data visualisation shows the number of Aboriginal and Torres Strait Islander children with a substantiated maltreatment assessment in 2021–22, by primary and other types of abuse or neglect. Data are displayed for each state and territory and Australia.


