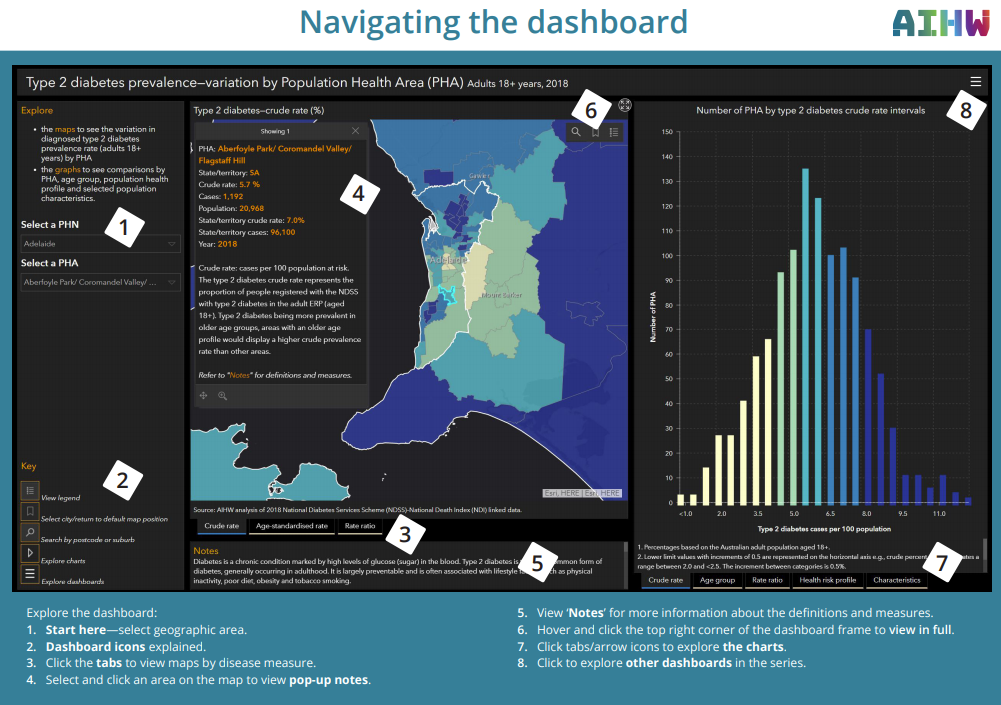
1. Start here – select geographic area:
- Population Health Area (PHA)
- Primary Health Network (PHN)
- State/territory
Enter new selection here to update the map and charts for a different geographic area.
2. Dashboard icons explained
Refer to the Key for an explanation of icon actions.
3. View maps by disease measure
Click the tabs to view maps by:
- crude rate
- age-standardised rate
- rate ratio
4. View pop-up notes
Select and click on an area within the map to view pop-up notes.
5. View 'Notes'
Scroll through the 'Notes' for more information about the definitions and measures. Hover and click top-right hand corner of the frame to view in full.
For detailed information, refer to the Technical notes.
6. View dashboard frame in full
Hover and click the top right corner of each dashboard frame to view in full. Click this icon again to return to default view.
7. Explore the charts
If viewing on a small screen e.g., laptop or iPad/tablet, click the 'Explore charts' icon ![]() to move between the charts. Larger screens will display individual chart tabs.
to move between the charts. Larger screens will display individual chart tabs.
Available charts include:
- Crude rate
- Age group
- Rate ratio
- Health risk profile
- Characteristics
Note: 'No selection' or 'No data' label in the charts indicates a geographic area needs to be selected (see point 1).
8. Explore other dashboards in the series
Click to view other dashboards in the series by:
- Disease (type 2 diabetes, cardiovascular disease, chronic kidney disease, dialysis and acute kidney injury)
- Measure (prevalence, hospitalisation, death)
- Geographic area (state/territory, PHN, PHA).