Geographical structure
The levels of geography reported in the dashboards include:
- state and territory
- Primary Health Network (PHN)
- Population Health Area (PHA)
The Australian Statistical Geographical Standard
This study utilises area of usual residence data in regards to Statistical Area Level 2 (SA2) regions. These regions are sourced from the 2016 Australian Statistical Geography Standard (ASGS) produced by the Australian Bureau of Statistics (ABS). The main structure of the ASGS (as seen in Box 1) allows for statistical reporting, broadly based on the concept of functional areas at a variety of scales.
In this regard, SA2s are a general-purpose medium-sized area built from whole Statistical Area Level 1s (SA1s; Box 1) and represent a community with social and economic interaction within an average population of about 10,000 persons. There are currently 2,310 SA2s within Australia.
SA2s are the lowest-level ASGS structure for which estimated resident population (ERP), health and vitals, and other non-Census ABS data are generally available. SA2-level data can be aggregated up to the PHA and PHN levels using concordance files available from the ABS.
Box 1: Hierarchical construction of Statistical Area Levels from the 2016 ASGS
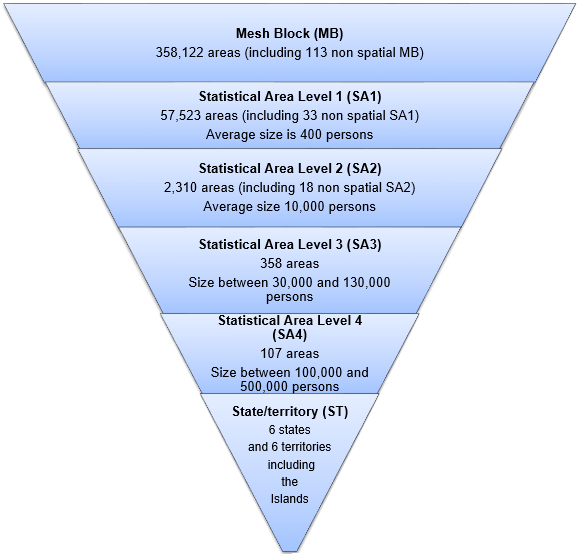
Source: ABS 2016
Primary Health Network
A PHN is an independent primary health care organisation established to commission health services to meet the identified and prioritised needs of people in their region. PHNs work collaboratively within their regions to integrate health services at the local level to create a better experience for patients, encourage better use of health resources, and eliminate service duplication.
Thirty-one PHNs were established at a regional level across Australia in 2015, replacing the previous 61 Medicare Locals. The boundaries of the PHNs align with Local Hospital Network boundaries (or equivalent), and take into account population size, alignment, state and territory borders and patient flow; as well as stakeholder input and administrative efficiencies (Department of Health 2018). Not all PHN boundaries align directly with the ABS ASGS structure, for example, an SA2 boundary can be across 2 PHNs; making the direct comparison between PHN statistics and other geography standards, such as the ASGS, difficult. Correspondence files between the ASGS and the PHN regions, sourced from the ABS, were used to derive the PHN-based statistics presented in the product suite. Their large size in less-populated areas of Australia, particularly in jurisdictions with large Indigenous populations (such as the Northern Territory and Western Australia), may mask important intra-area variation, as shown in the PHN and PHA maps of this product. Table 1 shows the number of PHNs by jurisdiction.
|
State/territory |
Number of PHNs |
|---|---|
|
New South Wales |
10 |
|
Victoria |
6 |
|
Queensland |
7 |
|
Western Australia |
3 |
|
South Australia |
2 |
|
Tasmania |
1 |
|
Australian Capital Territory |
1 |
|
Northern Territory |
1 |
|
Australia |
31 |
Note: Correspondence files from SA2 to PHN are available from ABS 2017.
For more information on PHNs.
Population Health Area
PHAs comprise a combination of whole SA2s and multiple aggregates of smaller SA2s. This level of geography maintains much of the value of the SA2 geography, while ensuring that by aggregating smaller-population SA2s relatively few areas need to have data suppressed.
The Public Health Information Development Unit (PHIDU) from Torrens University developed PHAs in collaboration with state and territory health agencies. PHA updates occur after each government census, in line with changes to the ASGS.
In 2016, there were 1,165 PHAs in Australia derived from the 2016 ASGS. Table 2 summarises the number of SA2s within a PHA, with 39.7% of PHAs containing 1 SA2, 37.7% comprised of 2 SA2s and 15.8% comprised of 3 SA2s. While it is possible to examine variation within a PHN, some PHA regions span across PHN regions.
For more information Population Health Areas.
|
No. of SA2s per PHA |
Number of PHAs |
Per cent of PHAs |
|---|---|---|
|
1 |
463 |
39.7 |
|
2 |
439 |
37.7 |
|
3 |
184 |
15.8 |
|
4 |
43 |
3.7 |
|
5 |
17 |
1.5 |
|
6 |
8 |
0.7 |
|
7 |
3 |
0.3 |
|
8 |
3 |
0.3 |
|
9 |
5 |
0.4 |
|
Total |
1,165 |
100.0 |
Note: Numbers may not sum to the total due to rounding.
Source: PHIDU 2016.
References
ABS (Australian Bureau of Statistics) 2016. Australian statistical geography standard (ASGS): Volume 1- Main structure and greater capital city statistical areas. ABS cat. 1270.0.55.001. Canberra: ABS. Viewed 19 August 2020.
Department of Health, 2018. Department of Health: PHN Background. Canberra: Department of Health. Viewed 6 April 2021.
PHIDU (Public Health Information Development Unit) 2016. Population Health Areas: overview. Adelaide: Torrens University. Viewed 1 April 2020.