What period of the COVID-19 pandemic is covered?
The report uses provisional mortality data from the Australian Bureau of Statistics (ABS) and shows people who died in the first 10 months of 2020 (between 1 January and 27 October), which includes the majority of deaths from the beginning of the pandemic in Australia to the end of the second outbreak in Victoria. Data from November and December 2020 were not available at the time of writing, but there were no other COVID-19 outbreaks with a high number of deaths in Australia during those months.
This report refers to 2 ’waves’ of the COVID-19 pandemic in Australia – by this we mean a steep increase in the number of infections or cases, a peak, and then a decline in the number of infections. Pandemic waves provide context for when Australia faced the most intensive period of COVID-19 infections and deaths in 2020, as well as related restrictions aimed at containing the spread of the virus:
- wave 1 (from 4 March to 26 May) was predominantly in New South Wales, was shorter than wave 2, and resulted in fewer COVID-19 deaths than wave 2
- wave 2 (from 24 June to 27 October) was predominantly in Victoria, saw extended lockdown measures enforced particularly in Greater Melbourne, and is when the majority of Australia’s COVID-19 deaths occurred.
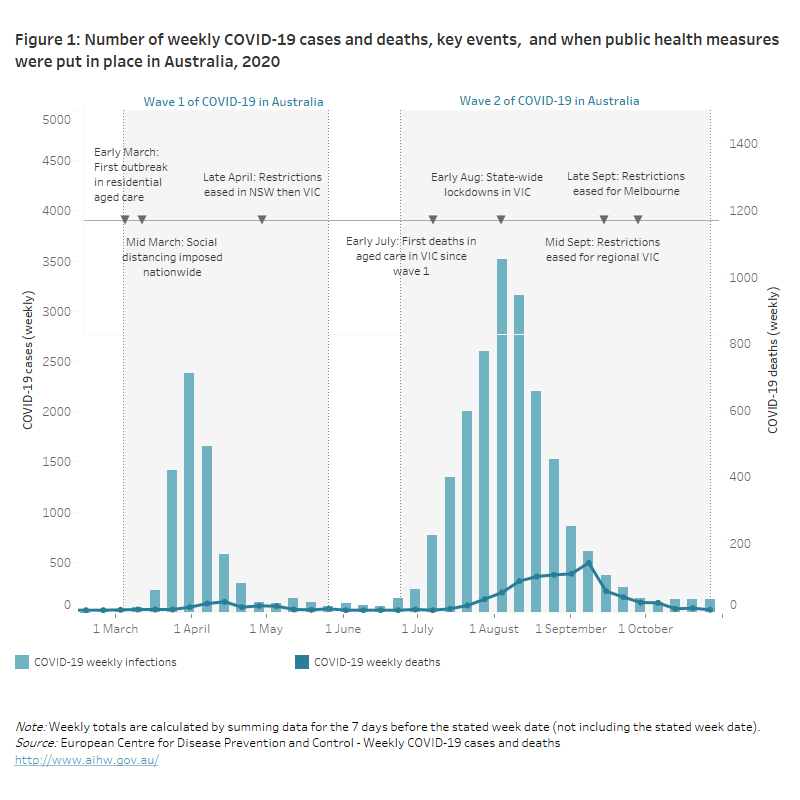
Figure 1 shows a summary of key events related to COVID-19 in Australia, the number of weekly COVID-19 cases during the first 10 months of 2020, as well as trends in COVID-19 deaths over this period.
This figure shows there were 2 waves of COVID-19 cases in Australia during the first 10 months of 2020, and that it was during wave 2 (which started in late June and lasted to late October) when most deaths due to COVID-19 occurred. It also shows key events related to the COVID-19 pandemic, including when the first COVID-19 outbreak happened in residential aged care (early March), as well as when public health measures in response to outbreaks took place.


