Healthy teeth
Healthy teeth are an integral part of good oral health and enable people to eat, speak and socialise without pain, discomfort or embarrassment.
Key terms
- Deciduous teeth: Primary or ‘baby’ teeth that erupt (that is, become visible in the mouth) during infancy. A child usually has 20 deciduous teeth.
- Permanent teeth: Secondary or ‘adult’ teeth that start to erupt at around 6 years of age. A person usually has 32 permanent teeth.
- Dental caries: A disease process that can lead to cavities (small holes) in the tooth structure that compromise both the structure and the health of the tooth, commonly known as tooth decay.
- The dmft and DMFT score: A score that counts the number of teeth that are decayed (d), missing due to caries (m) or filled because of caries (f)— ‘dmft’ refers to deciduous teeth, ‘DMFT’ refers to permanent teeth.
- Dental caries experience: When a person has a dmft or DMFT score that is greater than zero, this is known as having dental caries experience.
How healthy are children’s teeth?
Data in this section were sourced from the National Child Oral Health Study 2012–14 (Do & Spencer 2016). This nationally representative population-based survey involved data from almost 25,000 children aged 5–14 from across Australia. Information was collected via a parental questionnaire and a detailed dental examination by trained dental professionals.
In 2011, oral diseases accounted for 8.1% and 4.1% of the non-fatal burden of disease among Australia children aged 5–9 and 10–14, respectively. Almost all (99%) non-fatal burden is due to dental caries making it the most prevalent oral disease in Australian children (AIHW 2019).
How many teeth are affected by decay?
The average number of teeth affected by decay gives an indication of the severity of disease.
Australian children aged 5–10 had an average of 1.5 decayed, missing and filled deciduous teeth
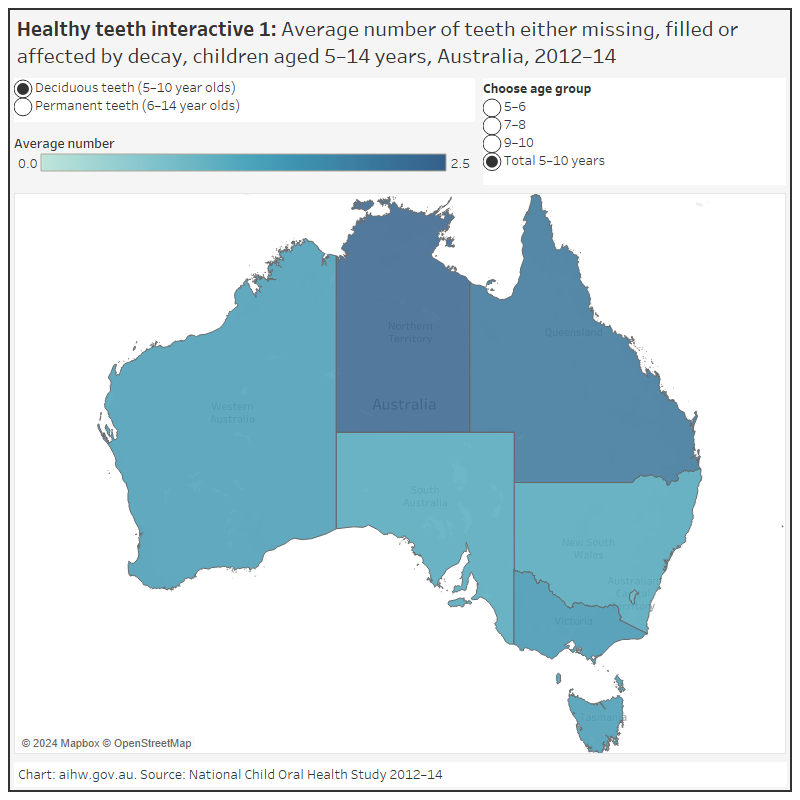
Dental caries experience for deciduous teeth of 5–10 year olds varied between states and territories. Interactive 1 shows that dmft:
- was highest in Northern Territory children with an average of 2.4 affected teeth per person, followed by Queensland children (2.1)
- was lowest for children in the Australian Capital Territory (1.0).
Australian children aged 6–14 had an average of 0.5 decayed, missing and filled permanent teeth
Dental caries experience for permanent teeth in 6–14 year olds varied between states and territories. Interactive 1 shows that DMFT:
- was highest in Northern Territory and Queensland children with an average of 0.8 affected teeth per person
- was lowest for children in the Australian Capital Territory (0.2).
Healthy teeth – Interactive 1
This figure shows the average number of decayed, missing or filled teeth (DMFT) for children by age group. State and territory data is presented for 2012–14. On average, children aged 6-14 years in the Australian Capital Territory had 0.2 decayed, missing or filled teeth.
See Data tables: Healthy teeth for data tables.
How does tooth decay vary for different populations?
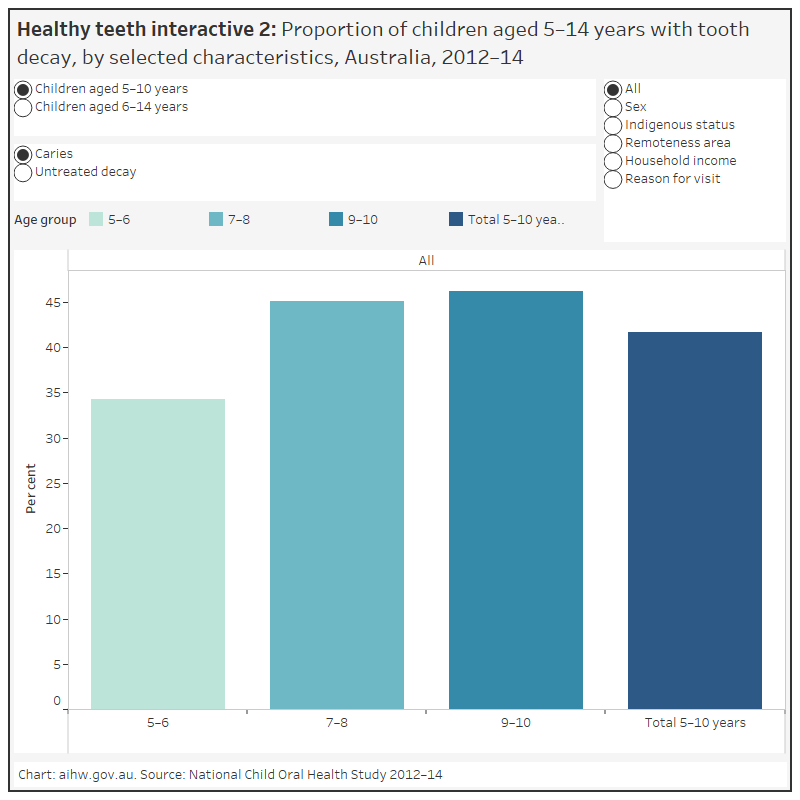
Oral health is determined by a complex interaction of factors, including social, economic, environmental and cultural factors, as described in the Introduction. Some populations face greater challenges in accessing oral health care and experience the greatest burden of poor oral health. A key indicator of the oral health status of a population is the dental caries experience (Interactive 2).
Children aged 5–10 with dental caries in their deciduous teeth were more likely to have last visited the dentist for a dental problem (68%) than for a check-up (36%)
Around 4 in 10 (42%) children aged 5–10 had experienced dental caries in their deciduous teeth. The proportion was:
- 1.5 times as high for Indigenous children (61%) as non-Indigenous children (41%)
- higher for those from low-income households (50%) than those from medium-income households (40%) and high-income households (33%)
- 1.4 times as high for those living in Remote and very remote areas as those living in Major cities.
Indigenous children (44%) aged 5–10 were more likely to have had at least one deciduous tooth with untreated decay than non-Indigenous children (26%)
Around 1 in 4 (27%) children aged 5–10 had at least one deciduous tooth with untreated decay. The proportion was:
- lower for children from high-income households (18%) than those from medium-income households (25%) and low-income households (36%)
- higher for those living in Remote and very remote locations (38%) than those living in all other locations
- almost twice as high for those whose reason for their last dental visit was for a dental problem (42%) than for those who went for a check-up (22%).
Children aged 6–14 with dental caries in their permanent teeth were more likely to have last visited the dentist for a dental problem (32%) than for a check-up (22%)
Around 1 in 4 (24%) children aged 6–14 had experienced dental caries in their permanent teeth. The proportion was:
- higher for Indigenous children (36%) than non-Indigenous children (23%)
- higher for those from low-income households (28%) than those from medium-income (22%) and high-income (19%) households
- higher for those living in Remote and very remote areas (28%) than those living in Major cities (22%).
Indigenous children (23%) aged 6–14 were more likely to have had at least one permanent tooth with untreated decay than non-Indigenous children (10%)
Around 1 in 10 (11%) children aged 6–14 had at least one permanent tooth with untreated decay. The proportion was:
- higher for those from low-income households (15%) than those from medium-income (9.2%) and high-income (6.6%) households
- twice as high for those living in Remote and very remote areas (22%) than those living in Major cities (9.9%)
- higher for those who last visited the dentist for a dental problem (15%) than those who last visited the dentist for a check-up (9.3%).
Healthy teeth – Interactive 2
This figure shows the proportion of children aged 5–10 and 6–14 years with caries or untreated tooth decay, by selected characteristics. National data is presented for 2012–14. In Australia, 41.7% of children aged 5-10 years and 23.5% of children aged 6-14 years had dental caries.
See Data tables: Healthy teeth for data tables.
How does tooth decay vary across states and territories?
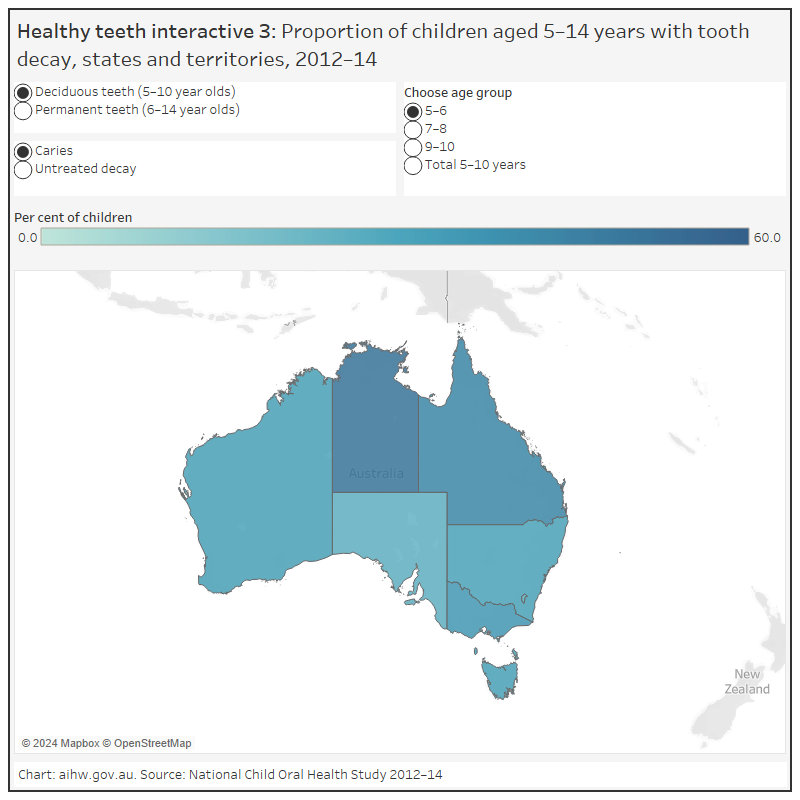
Levels of dental caries in Australian children varies across states and territories. This is partly related to differences in dental programs and policies implemented in each jurisdiction, and varying sociodemographic and socioeconomic profiles (Interactive 3).
Just over half (53%) of children aged 5–10 in the Northern Territory had dental caries in their deciduous teeth, and around 4 in 10 (40%) have at least one deciduous tooth with untreated decay
Around 4 in 10 (42%) Australian children aged 5–10 had dental caries in their deciduous teeth, and around 1 in 4 (27%) had at least one deciduous tooth with untreated decay.
The proportion of children with dental caries was lowest in the Australian Capital Territory (32%), while the proportion of children with untreated decay was lowest in South Australia (17%).
Around one-third (33%) of Northern Territory children aged 6–14 had dental caries experience in their permanent teeth, and around 1 in 5 (20%) had at least one permanent tooth with untreated decay
Around 1 in 4 (24%) Australian children aged 6–14 had dental caries in their permanent teeth, and around 1 in 10 (11%) had at least one permanent tooth with untreated decay.
The proportion of children with dental caries was lowest in the Australian Capital Territory (13%), while the proportion of children with untreated decay was lowest in South Australia (3.5%).
Healthy teeth – Interactive 3
This figure shows the proportion of children with caries or untreated tooth decay, by selected characteristics. State and territory data is presented for 2012–14. For children aged 5-10 years, the proportion of children with dental caries was lowest in the Australian Capital Territory (31.9%) and highest in the Northern Territory (53.1%).
See Data tables: Healthy teeth for data tables.
How healthy are adult’s teeth?
Data in this section were sourced from the National Survey of Adult Oral Health 2004–06 (Slade et al. 2007; AIHW 2008a–h) and the National Study of Adult Oral Health 2017–18 (Do & Luzzi, 2019). Each of these population-based surveys collected data from around 15,000 adults aged 15 years and over across Australia. Information was collected via interview and around one-third of participants underwent a dental examination.
In 2017–18, the survey found that most Australian adults have some experience of dental decay—fewer than 1 in 9 (11%) adults had no experience of dental decay in their permanent teeth.
How many teeth are affected by decay?
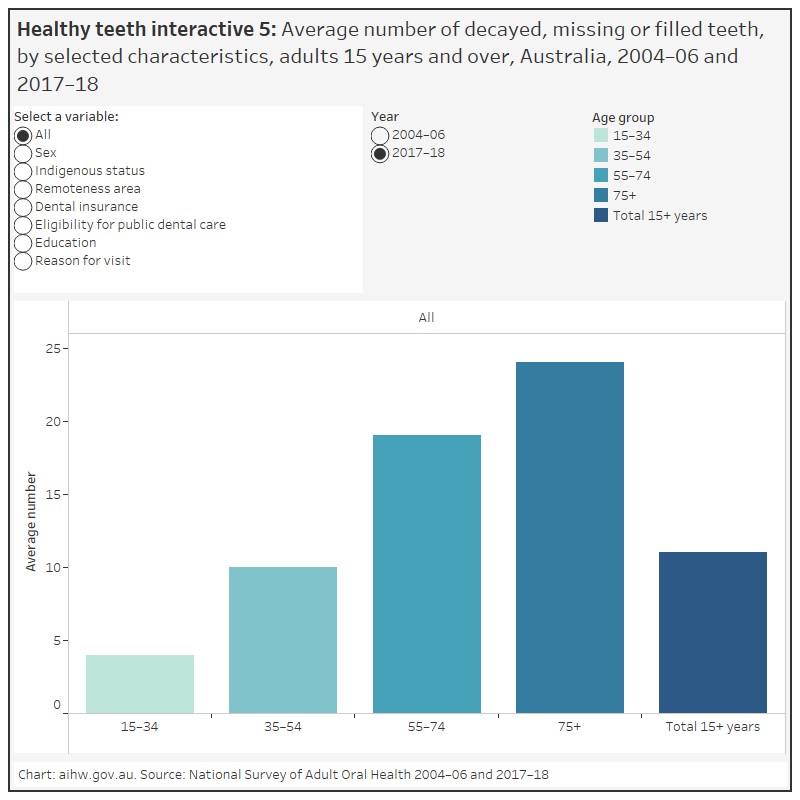
Australian adults aged 15 years and over had an average of 11.2 decayed, missing and filled teeth in 2017–18
The number of decayed, missing and filled teeth (DMFT) reflects a person’s lifetime experience of dental caries in their permanent teeth. The DMFT index is a cumulative score (that is, it measures all evidence of decayed, missing and filled teeth over a person’s life) and is therefore strongly associated with age.
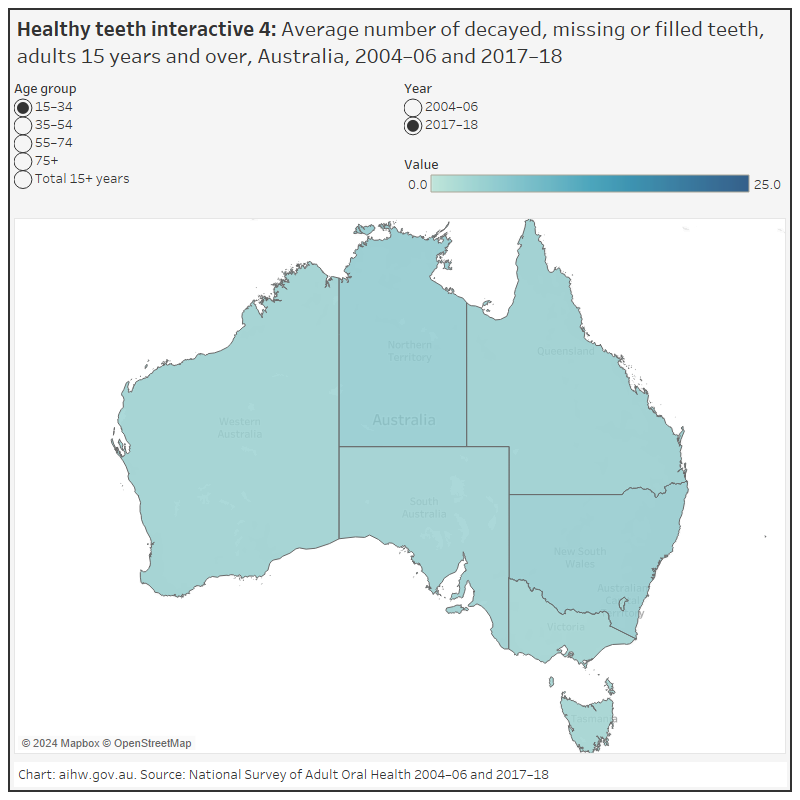
The average number of teeth affected by dental caries per person in Australia increased with age, from an average of 4.1 in 15–34 year olds to 10.3 in 35–54 year olds, 19.4 in 55–74 year olds and 24.4 in people aged 75 and older in 2017–18
In 2017-18, the average DMFT per person was:
- lowest in the Australian Capital Territory (9.7) and the Northern Territory (9.7)
- ranged from an average of 3.3 affected teeth in 15–34 year olds to 24.9 affected teeth in those aged 75 years and over in the Australian Capital Territory
- ranged from an average of 5.2 affected teeth in 15–34 year olds to 21.7 affected teeth in those aged 75 years and over in the Northern Territory.
Healthy teeth – Interactive 4
This figure shows the average number of decayed, missing or filled teeth, for adults aged 15 years and over. State and territory data is presented for 2004–2006 and 2017–2018. On average, adults aged 15 years and over had 9.7 decayed, missing or filled teeth in the Northern Territory and the Australian Capital Territory in 2017–2018.
See Data tables: Healthy teeth for data tables.
Whose teeth are affected by tooth decay?
In addition to age, DMFT scores also reflect different exposures to risk factors and protective factors a person has during their life (Interactive 5).
On average, females aged 15 and over had slightly more teeth with caries experience than males, 12.0 and 10.4 respectively in 2017–18
In 2017-18:
- Adults who completed Year 10 or less of schooling had a higher average number of decayed, missing and filled teeth (15.6) compared with those who had completed additional schooling (9.7). For those who had completed Year 10 or less, the number of teeth affected increased with age from an average of 3.7 teeth in 15-34 year olds, 12.2 teeth in 35–54 year olds, 19.7 in 55–74 year olds and 24.5 in people aged 75 and over.
- Adults who were eligible for public dental care had a higher average number of decayed, missing and filled teeth (15.7) compared with those who were ineligible for public dental care (9.3). For those eligible for public dental care, the number of teeth affected increased with age, from an average of 4.5 in 15–34 year olds to 12.6 in 35–54 year olds, 20.0 in 55–74 year olds and 24.5 in those aged 75 and over.
-
Adults who usually visit a dentist for a check-up had a lower average number of decayed, missing or filled teeth (10.1) compared with those who usually visit the dentist for a dental problem (13.2).
Healthy teeth – Interactive 5
This figure shows the average number of decayed, missing or filled teeth, for adults aged 15 years and over, by selected characteristics. National data is presented for 2004–06 and 2017–2018. In Australia, adults aged 15 years and over had an average of 11.2 decayed, missing or filled teeth for in 2017–18.
See Data tables: Healthy teeth for data tables.
How does untreated tooth decay vary across states and territories?
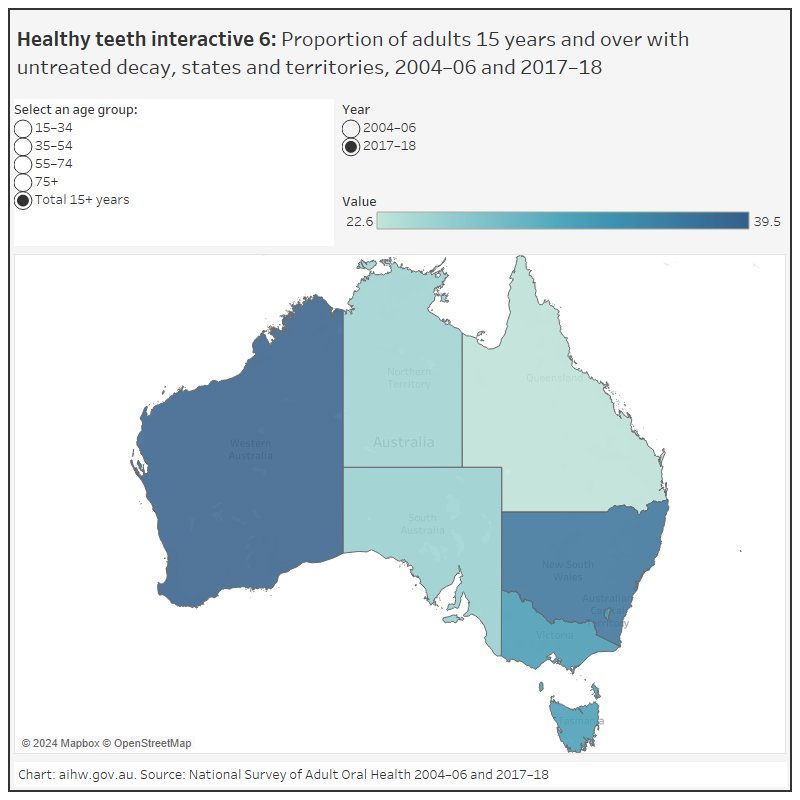
Untreated tooth decay reflects both the prevalence of dental decay in the population and access to dental care for treatment (Interactive 6).
The percentage of adults with untreated dental decay was highest in Western Australia (40%) in 2017–18
Around 1 in 3 (32%) adults aged 15 and over with their own teeth have at least one tooth with untreated dental decay.
Healthy teeth – Interactive 6
This figure shows the proportion of adults aged 15 years and over with untreated decay. State and territory data is presented for 2004–06 and 2017–2018. In 2017–2018, Queensland had the lowest proportion of adults with untreated decay (22.6%) and Western Australia had the highest (39.5%).
See Data tables: Healthy teeth for data tables.
Who has untreated tooth decay?
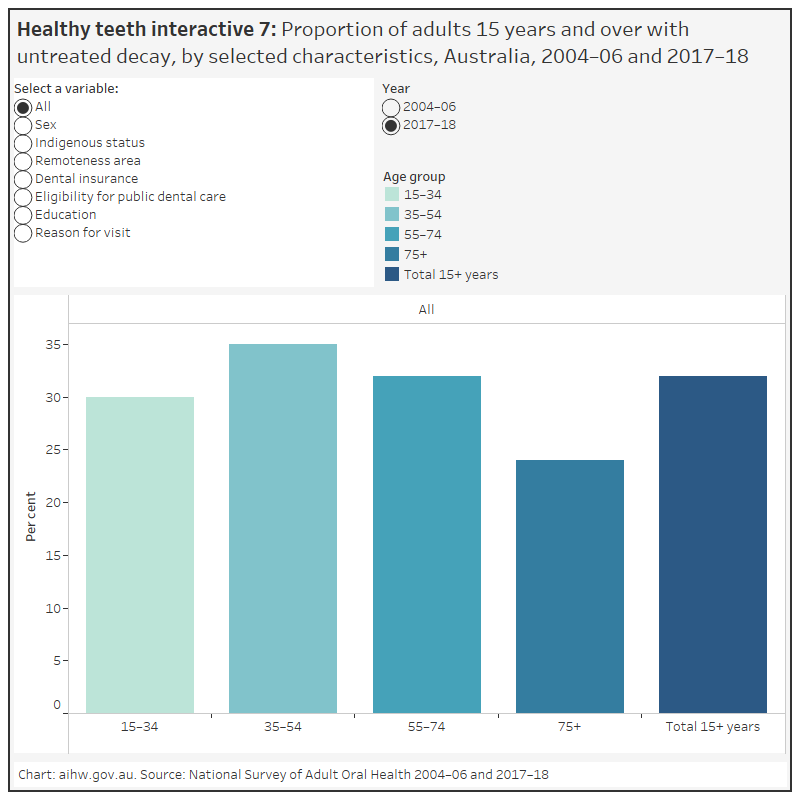
The prevalence of untreated tooth decay is more closely related to socioeconomic and sociodemographic factors than to age (Interactive 7).
Adults aged 15 and over who usually visited the dentist for a problem were nearly twice as likely as those who usually visited for a check-up to have at least one tooth with untreated dental decay (44% compared with 24%) in 2017–18
- More adults eligible for public dental care (35%) had at least one tooth with untreated dental decay than those ineligible for public dental care (31%).
- Fewer adults with private dental insurance (24%) had at least one tooth with untreated dental decay than those without dental insurance (39%).
Healthy teeth – Interactive 7
This figure shows the proportion of adults aged 15 years and over with untreated decay, by selected characteristics National data is presented for 2004–06 and 2017–2018. In Australia, 32.1% of adults aged 15 years and over had untreated decay in 2017–2018.
See Data tables: Healthy teeth for data tables.
AIHW (Australian Institute of Health and Welfare) Dental Statistics and Research Unit 2008a. The National Survey of Adult Oral Health 2004–06: Australian Capital Territory. Cat. no. DEN 175. Dental Statistics and Research series no. 39. Canberra: AIHW.
AIHW Dental Statistics and Research Unit 2008b. The National Survey of Adult Oral Health 2004–06: New South Wales. Cat. no. DEN 176. Dental Statistics and Research series no. 40. Canberra: AIHW.
AIHW Dental Statistics and Research Unit 2008c. The National Survey of Adult Oral Health 2004–06: Northern Territory. Cat. no. DEN 177. Dental Statistics and Research series no. 41. Canberra: AIHW.
AIHW Dental Statistics and Research Unit 2008d. The National Survey of Adult Oral Health 2004–06: Queensland. Cat. no. DEN 178. Dental Statistics and Research series no. 42. Canberra: AIHW.
AIHW Dental Statistics and Research Unit 2008e. The National Survey of Adult Oral Health 2004–06: South Australia. Cat. no. DEN 179. Dental Statistics and Research series no. 43. Canberra: AIHW.
AIHW Dental Statistics and Research Unit 2008f. The National Survey of Adult Oral Health 2004–06: Tasmania. Cat. no. DEN 180. Dental Statistics and Research series no. 44. Canberra: AIHW.
AIHW Dental Statistics and Research Unit 2008g. The National Survey of Adult Oral Health 2004–06: Victoria. Cat. no. DEN 181. Dental Statistics and Research series no. 45. Canberra: AIHW.
AIHW Dental Statistics and Research Unit 2008h. The National Survey of Adult Oral Health 2004–06: Western Australia. Cat. no. DEN 182. Dental Statistics and Research series no. 46. Canberra: AIHW.
Australian Institute of Health and Welfare 2019. Australian Burden of Disease Study: impact and causes of illness and death in Australia 2015. Cat. no. BOD 22. Canberra: AIHW. doi:10.25816/5ebca2a4fa7dc
Do LG & Spencer AJ (Editors) 2016. Oral health of Australian children: the National Child Oral Health Study 2012–14. Adelaide: University of Adelaide Press.
Slade GD, Spencer AJ, Roberts-Thomson KF (Editors) 2007. Australia’s dental generations: the National Survey of Adult Oral Health 2004–06. Dental Statistics and Research series no. 34. AIHW cat. no. DEN 165. Canberra: AIHW.


