People with additional and/or specialised health care needs
This group includes people living with mental illness, people with physical, intellectual and developmental disabilities, people with complex medical needs and frail older people. These people can be vulnerable to oral disease; for example, some medications for chronic diseases can cause a dry mouth, which increases the risk of tooth decay (Queensland Health 2008). A number of factors make accessing dental care more difficult for this group, including:
- a shortage of dental health professionals with skills in special-needs dentistry
- difficulties in physically accessing appropriate dental treatment facilities
- the cost of treatment. People with additional and/or specialised health care needs often have their earning capacity eroded by ill health (COAG 2015).
People with disability
Around 1 in 6 (18%) people in Australia—or about 4.4 million—have disability (AIHW 2022). Some people with disability experience difficulties accessing and using health services. Barriers can include longer than desired waiting times, the cost of services, the accessibility of buildings and direct or indirect discrimination by health professionals. Some people with disability may also experience issues caused by a lack of communication between the health professionals treating them (AIHW 2022).
This chapter highlights dental-related findings presented in the People with disability in Australia report, with the data derived from the Australian Bureau of Statistics’ 2018 Survey of Disability, Ageing and Carers (SDAC) (ABS 2019).
Measuring and defining disability
There are many different concepts and measures of disability, making comparisons across different data sources challenging. The AIHW promotes measures based on the International Classification of Functioning, Disability and Health (WHO 2001), which underpins the disability categories used here.
The SDAC is the most detailed and comprehensive source of disability prevalence in Australia. To identify disability, the SDAC asks participants if they have at least one of a list of limitations, restrictions or impairments, which has lasted, or is likely to last, for at least 6 months and that restricts everyday activities.
The limitations are grouped into 10 activities associated with daily living, and a further two life areas in which people may experience restriction or difficulty as a result of disability – school and employment.
The level of disability is defined by whether a person needs help, has difficulty, or uses aids or equipment with 3 core activities – self-care, mobility, and communication – and is grouped for mild, moderate, severe, and profound limitation. People who ‘always’ or ‘sometimes’ need help with one or more core activities, have difficulty understanding or being understood by family or friends, or can communicate more easily using sign language or other non-spoken forms of communication are referred to in this section as ‘people with severe or profound disability’.
Key terms
- Dental caries: A disease process that can lead to cavities (small holes) in the tooth structure that compromise both the structure and the health of the tooth, commonly known as tooth decay.
- Dental services: Services that registered dental practitioners provide. These include oral and maxillofacial surgery items, orthodontic, pedodontic and periodontic services, cleft lip and palate services, dental assessment and other dental items listed in the MBS. The term covers dental services funded by health funds, state and territory governments and also individuals’ out-of-pocket payments.
Use of dental services
Around 1 in 2 (51% or 1.2 million) people with disability aged under 65 living in households saw a dental professional for their own health in the last 12 months. This rate is highest among females (55% or 648,000), those in the age group 0-24 (64% or 414,500), those with an intellectual disability (57% or 305,500), and those living in major cities (53% or 855,200).
Explore the data using the interactive below.
People with disability interactive 1.
This figure shows the use of dental services by people with disability in the last 12 months, by sex and selected characteristics. National data is presented for 2018.

See Data tables: Priority populations for data tables.
Cost barrier
Around 1 in 4 (27.5% or 449,400) people aged under 65 with disability living in households who needed to see a dental professional in the last 12 months delayed seeing or did not see a dental professional because of cost. This rate is highest among females (30% or 253,400), those aged 25-64 (34% or 394,600), those living in outer regional and remote areas (30% or 45,800), and those with a head injury, stroke or acquired brain injury (33.5% or 37,200) or other disability (34% or 228,200).
Explore the data using the interactive below.
People with disability interactive 2
This figure shows the financial barriers to dental care for people with disability, by sex and selected characteristics. National data is presented for 2018.

See Data tables: Priority populations for data tables.
Public dental waiting list
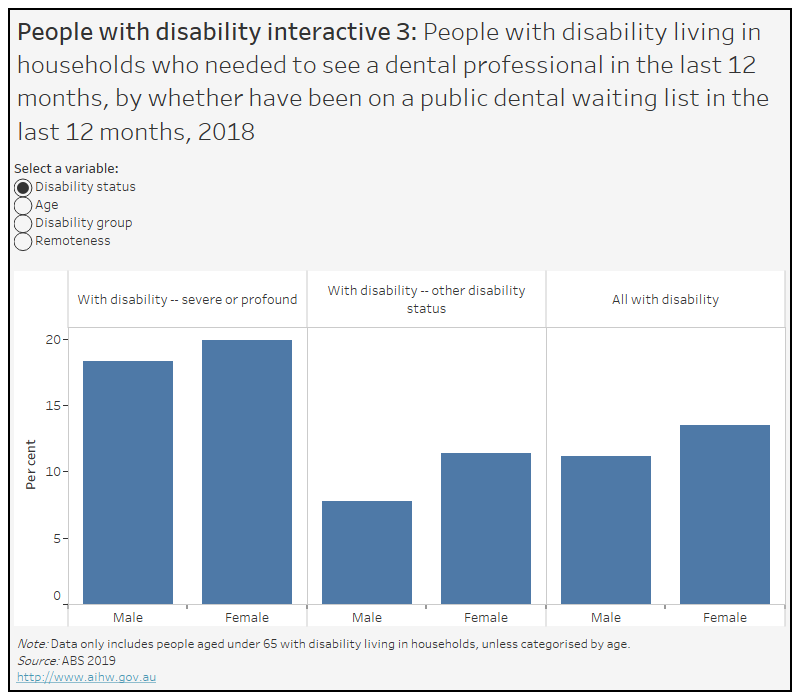
Around 1 in 8 (12.5% or 201,500) people aged under 65 with disability living in households who needed to see a dental professional in the last 12 months have been on a public waiting list for dental care. This rate is highest among those with severe or profound disability (19.5% or 91,900), those in age group 25-64 (13% or 152,600), those with head injury, stroke or acquired brain injury (21.5% or 23,600), and those living in outer regional and remote areas (14.7% or 22,000).
Explore the data using the interactive below.
People with disability interactive 3
This figure shows the percentage of people with disability that have been on a public dental waiting list in the last 12 months, by sex and selected characteristics. National data is presented for 2018.

See Data tables: Priority populations for data tables.
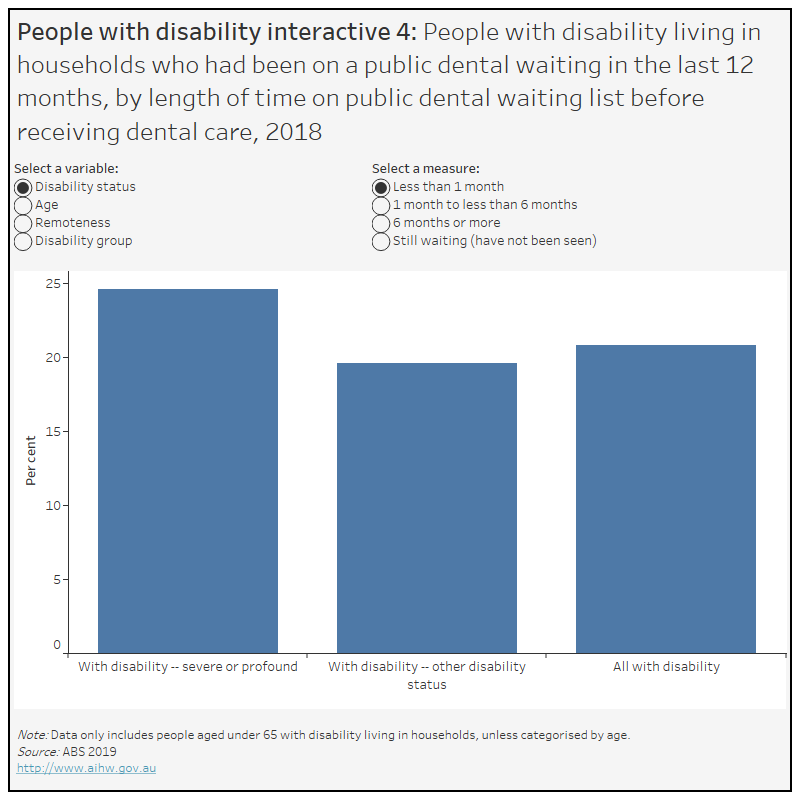
Around 3 in 10 (30% or 61,000) people aged under 65 with disability living in households who had been on a public dental waiting list in the last 12 months have not received dental care. This rate is highest among females (31% or 35,300), those in the age group 25-64 (34% or 51,800), and those with sensory and speech disability (32% or 17,000).
Explore the data using the interactive below.
People with disability interactive 4
This figure shows the length of time on a public waiting list before receiving dental care for people with disability in the last 12 months, by selected characteristics. National data is presented for 2018.

See Data tables: Priority populations for data tables.
Older Australians
Older people make up a considerable proportion of Australia’s population—at 30 June 2020, over 1 in 6 people were aged 65 and over. The Older Australians report explores aspects of health and wellbeing of older people, including their oral health and their use of dental services.
There are many programs and services available to support the health of older Australians. Older people’s access to these services may vary according to where they live, their access to transport, their health and cultural background, as well as socioeconomic factors.
Oral health generally deteriorates over a person’s lifetime, and oral disease can impact on people’s health and wellbeing more broadly.
In 2017–18, older Australians aged 65 and over had an average of 13.7 missing teeth. Most (59%) suffered periodontitis and around one-quarter (27%) avoided eating some foods due to problems with their teeth, mouth or dentures.
According to the 2017–18 National Survey of Adult and Oral Health, almost 3 in 5 older people saw a dentist in the last 12 months.
The cost of dental services is often reported as a barrier to accessing services. In 2017–18, of people aged 75 and over:
- 22% avoided or delayed dental care due to cost.
- 18% reported they would have difficulty paying a $200 dental bill.
- 9.8% reported cost prevented dental treatment.
ABS (Australian Bureau of Statistics) 2019. Disability, Ageing and Carers, Australia: Summary of findings, 2018. Canberra: ABS. Viewed 1 September 2022.
Australian Institute of Health and Welfare (2022) People with disability in Australia, AIHW, Australian Government, accessed 1 September 2022.
WHO (World Health Organization) (2001) International Classification of Functioning, Disability and Health, WHO, accessed 1 September 2022.
Australian Institute of Health and Welfare (2021) Older Australians, AIHW, Australian Government, accessed 07 February 2022.


