Potentially preventable hospitalisations
Reducing the rates of potentially preventable hospitalisations (PPHs) due to dental conditions is one of the Key Performance Indicators of the National Oral Health Plan 2015–2024 (COAG Health Council 2015). Hospital separation rates for PPHs provide important information about the extent to which timely and adequate non-hospital dental care has been provided. The rate of PPHs for dental conditions is influenced by a number of factors including:
- adequacy of preventive and primary care services
- prevalence of severe dental disease in the community
- availability and accessibility of appropriate community and hospital-based services (COAG Health Council 2015).
In Australia, the age-standardised rate of potentially preventable hospitalisations due to dental conditions (per 1,000 population) remained relatively stable between 2010–11 and 2021–22, ranging from 2.6 to 3.2 per 1,000 population
- In 2021–22, the age-standardised rate of potentially preventable hospitalisations due to dental conditions (per 1,000 population) was highest in South Australia (4.2 per 1,000 population) and lowest in Victoria and the Northern Territory (both 2.5 per 1,000 population).
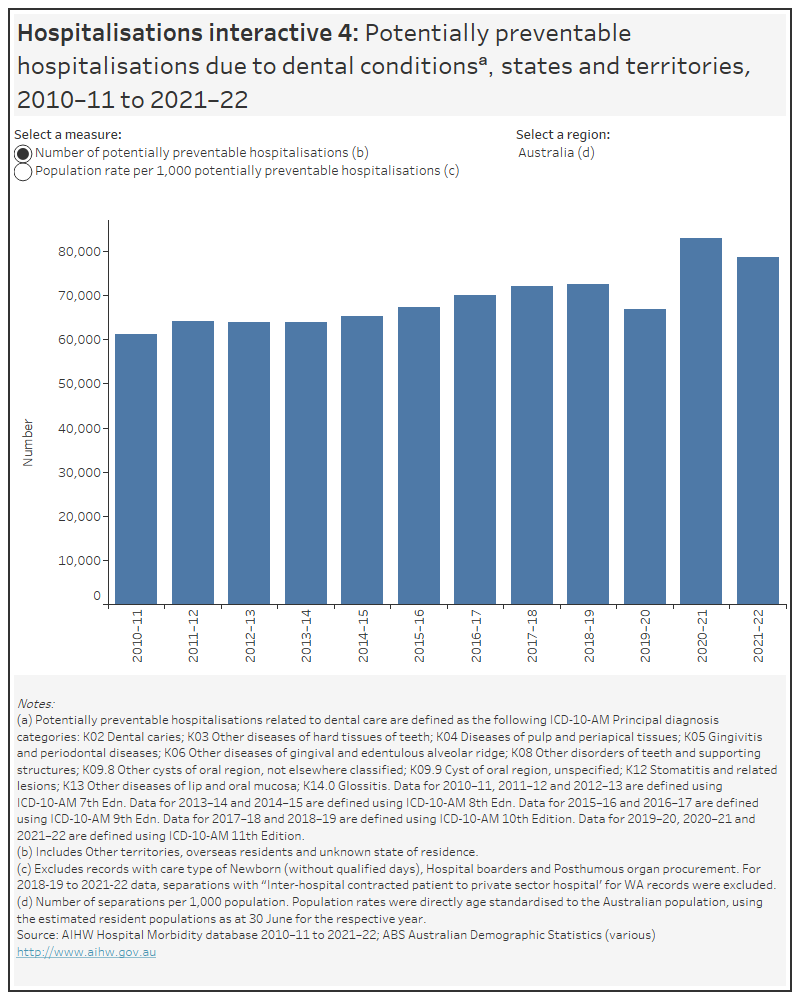
- In 2021–22, about 78,800 hospitalisations for dental conditions could potentially have been prevented with earlier treatment.
Explore the number or rate of potentially preventable hospitalisations due to dental conditions across Australia between 2010–11 and 2021–22 using the Hospitalisations interactive 4 below.
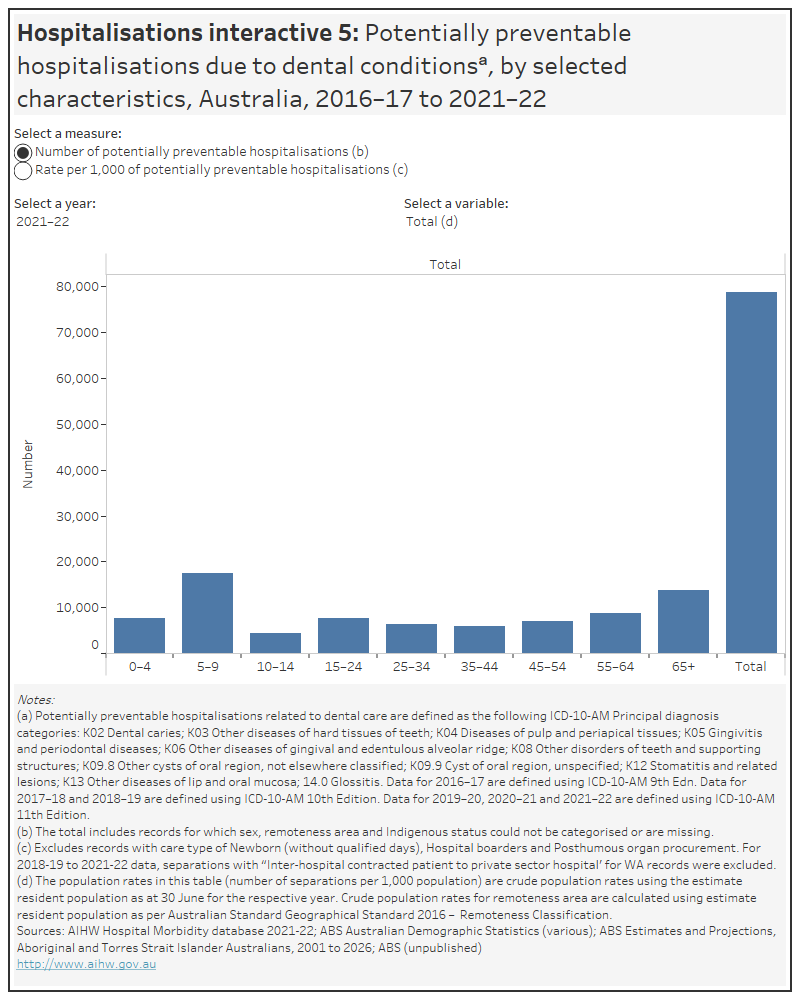
This figure shows the number and rate per 1,000 population of potentially preventable hospitalisations due to dental conditions, by selected characteristics. National data is presented by year, for 2016–17 through to 2021–22. In Australia, there were 3.1 per 1,000 population potentially preventable hospitalisations due to dental conditions in 2021–22.

See Data tables: Hospitalisations for data tables.
In 2021–22, the rate of potentially preventable hospitalisations due to dental conditions (per 1,000 population) was higher for Indigenous Australians (4.8 per 1,000 population) than for Other Australians (2.9 per 1,000 population)
- In 2021–22, the rate of potentially preventable hospitalisations due to dental conditions (per 1,000 population) was highest in those aged 5–9 years (10.8 per 1,000 population).
- In 2021–22, the rate of potentially preventable hospitalisations due to dental conditions (per 1,000 population) generally increased as remoteness increased, ranging from 2.9 per 1,000 population in Major cities to 4.0 per 1,000 population in Very remote areas.
Explore the number or rate of potentially preventable hospitalisations due to dental conditions by selected characteristics using the Hospitalisations interactive 5 below.
This figure shows the number and population rate per 1,000 of potentially preventable hospitalisations due to dental conditions. National, state and territory data is presented for 2010–11 to 2021–22. In Australia, there were 78,761 potentially preventable hospitalisations due to dental conditions in 2021–22.

See Data tables: Hospitalisations for data tables.
The COVID-19 pandemic has impacted every aspect of the Australian health system, including the provision of dental care services (refer to Impact of COVID-19 on dental services for more detail).
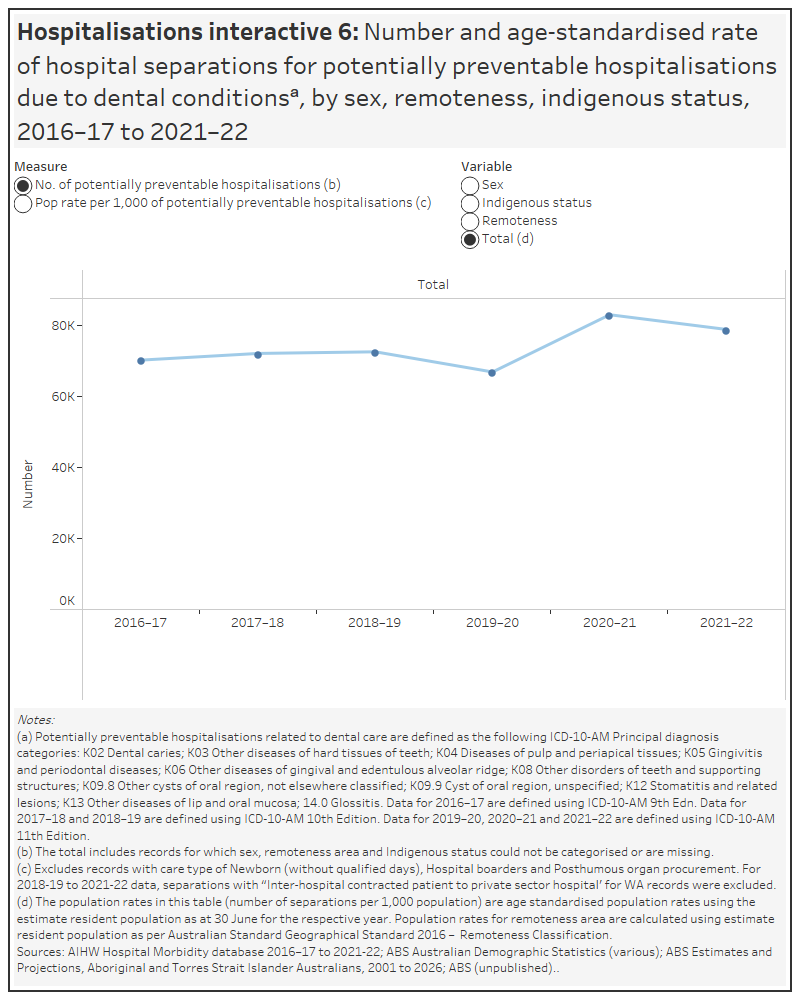
The rate of potentially preventable hospitalisations due to dental conditions has fluctuated over time, from a low of 2.6 separations per 1,000 population in 2019–20, a year affected by COVID-19, to a high of 3.2 separations per 1,000 population in 2020-21.
In 2021–22, the rate of potentially preventable hospitalisations due to dental conditions was 3.1 separations per 1,000 population
Between 2016–17 and 2021–22, the rate of potentially preventable hospitalisations due to dental conditions was consistently higher for:
- females than males
- Indigenous Australians than Other Australians
- those living in Very remote areas than those living in Major cities.
Explore the trend of potentially preventable hospitalisations due to dental conditions using the Hospitalisations interactive 6 below.
This figure shows the number and age-standardised rate of hospital separations for potentially preventable hospitalisations due to dental conditions, by selected characteristics. The rate of potentially preventable hospitalisations fluctuated over the period from 2016-17 to 2021-22, from a low of 2.6 per 1,000 population in 2019–20 to a high of 3.2 per 1,000 population in 2020-21.

See Data tables: Hospitalisations for data tables.


