Homelessness services
SHS clients with disability
About 1 in 10 (9.5% or 25,900) Specialist Homelessness Services (SHS) clients in 2022–23 had disability.
Homelessness at first report
In 2022–23, 48% of SHS clients with disability were homeless at first report, as were 47% of clients without disability.
Complex support needs
SHS clients with disability need more support services (an average of 12.4 services compared with 8.8 for clients without disability) and longer support (81 days compared with 56)
(2022–23).
On this page:
Introduction
Safe and secure housing is fundamental to people's health and wellbeing. Access to affordable housing is a key issue for everyone, particularly those on low incomes. A lack of affordable housing puts households at an increased risk of experiencing housing stress and can affect their health, education and employment and place them at risk of homelessness (AIHW 2022).
Anyone can be affected by homelessness; however, some groups, such as people with disability, may face additional risk factors, such as limited engagement with the labour market, discrimination and low income (AIHW 2022). These factors increase their likelihood of experiencing homelessness, or present additional barriers to exiting homelessness (see ‘Employment’, ‘Disability discrimination’ and ‘Income and finance’ for more information on these life areas).
People with disability may also have specific accommodation and support needs beyond those of the general population.
People with disability who are homeless or at risk of homelessness can use specialist homelessness services (SHS). These services are funded by governments to:
- provide accommodation support to people in need
- support at-risk clients to remain housed
- provide services intended to support stable living conditions, such as counselling, employment or financial services.
Data note
Data on this page are sourced from the AIHW's Specialist Homelessness Services Collection (SHSC). Unless otherwise indicated, the reported data refer to 2022–23.
The SHSC comprises a Client Collection and an Unassisted Persons Collection. Disability status is not collected in the Unassisted Persons Collection, therefore this section reports on Client Collection only.
The Client Collection captures information on everyone who receives service from an SHS agency. Information is collected at the start of a support period, each month within the support period, and the end of a support period.
How does SHSC capture disability information?
The SHSC uses a shortened version of the AIHW's standardised disability flag since 2013–14.
In the SHSC, disability is defined as limitation with core activities due to a long-term health condition or disability.
Core activities are:
- self-care – for example, showering or bathing, dressing or undressing, eating food
- mobility – for example, moving around the house, getting in or out of a chair
- communication – for example, understanding or being understood by people, including people they know.
Clients are identified as having disability if they require assistance, have difficulty, or use aids or equipment for core activities. This group is referred to in this section as ‘clients with disability’.
Clients who always or sometimes need assistance with core activities are referred to in this section as ‘clients with severe or profound disability’. Note that some AIHW reports, such as the Specialist homelessness services annual report, restrict their disability reporting to clients with severe or profound disability only.
Clients who have disability but no core activity limitation are not identified as having disability in the SHSC. This includes the small proportion of clients not identified as having disability, but who need disability services (1.1% or 2,500).
All clients are asked the SHSC disability questions, however response rates to the disability flag are relatively low. For example, the number of clients with invalid responses to the flag in 2022–23, while small compared with total clients (273,700), was similar to the number of clients with disability (25,900 with disability and 24,400 with missing disability status) (AIHW 2023).
Differences in the interpretation of disability questions for young children mean data may not be comparable across age groups. For this reason, children aged 9 or under were excluded from some analyses.
See the SHSC Data Quality Statement and SHSC disability flag for more information.
Demographics
In 2022–23, about 274,000 clients received support from specialist homelessness services. Among SHS clients, 9.5% (or 25,900) have disability and 82% (or 223,400) have no disability. A further 8.9% (or 24,400) of SHS clients have an unknown disability status.
About 3 in 10 (29% or 7,600) clients with disability have severe or profound disability (or 2.8% of all SHS clients) (AIHW 2023).
Sex
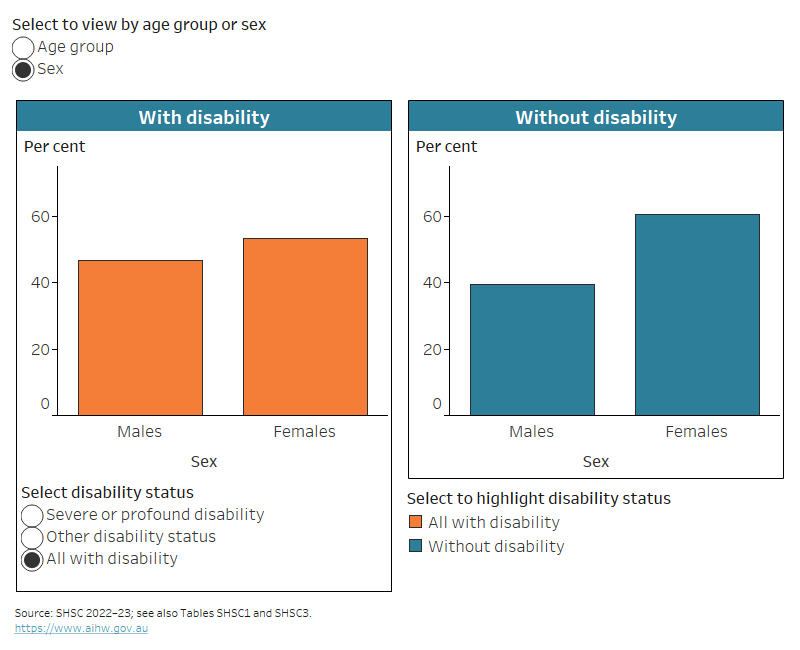
There are relatively more males among clients with disability (47% or 12,100) than among clients without disability (40% or 88,400) (Figure HOMELESSNESS.1, AIHW 2023).
Figure HOMELESSNESS.1: Specialist Homelessness Services (SHS) clients, by disability status and severity, age group and sex, 2022–23
The chart shows that SHS clients with disability fall into older age groups, and are more likely to be male, than clients without disability.
Notes:
- Data by age group are for people aged 10 and over.
- ‘With disability’ refers to clients who have core activity limitation. ‘Without disability’ may include clients who have disability but no core activity limitation.
Source data tables: Data tables – Homelessness services. View data tables
Disability is less common in female SHS clients than male clients – 8.5% of female SHS clients have disability, compared with 11% of male clients (Table HOMELESSNESS.1).
Disability status | Males | Females | Total |
|---|---|---|---|
With disability | 10.9 | 8.5 | 9.5 |
Severe or profound disability | 3.4 | 2.3 | 2.8 |
Other disability | 7.5 | 6.1 | 6.7 |
Without disability | 79.5 | 83.1 | 81.6 |
Disability status not known | 9.6 | 8.5 | 8.9 |
Total | 100.0 | 100.0 | 100.0 |
Note: ‘With disability’ refers to clients who have core activity limitation. ‘Without disability’ may include clients who have disability but no core activity limitation.
Source: AIHW 2023; see also Table SHSC1, Data tables – Homelessness services. View data tables
Age
Clients with disability are more likely to be older than clients without disability. In 2022–23, among SHS clients aged 10 or over, 13% (or 3,000) of clients with disability were aged 65 or over, compared with 3.4% (or 6,400) of clients without disability (Figure HOMELESSNESS.1).
Disability is more common in older SHS clients:
- 3 in 10 (29% or 3,000) of clients aged 65 and over have disability
- 1 in 10 (9.8% or 19,900) aged 15–64
- 1 in 25 (4.2% or 730) aged 10–14 (Table HOMELESSNESS.2).
Age group | Severe or profound disability | Other disability | All with disability | Without disability | Disability status not known | Total |
|---|---|---|---|---|---|---|
10–14 | 2.2 | 2.0 | 4.2 | 85.1 | 10.7 | 100.0 |
15–17 | 1.6 | 3.3 | 4.9 | 87.4 | 7.7 | 100.0 |
18–24 | 1.9 | 4.7 | 6.6 | 87.1 | 6.4 | 100.0 |
25–34 | 1.7 | 5.4 | 7.1 | 84.4 | 8.5 | 100.0 |
35–44 | 2.0 | 7.0 | 9.0 | 82.0 | 9.0 | 100.0 |
45–54 | 3.3 | 11.2 | 14.4 | 76.6 | 8.9 | 100.0 |
55–64 | 5.5 | 17.1 | 22.6 | 68.3 | 9.1 | 100.0 |
65 and over | 7.3 | 22.2 | 29.5 | 62.3 | 8.2 | 100.0 |
10 and over | 2.6 | 7.7 | 10.3 | 81.2 | 8.5 | 100.0 |
Notes:
- Data are for SHS clients aged 10 and over. While disability status is collected for all ages, data relating to children aged 0–9 should be interpreted with caution.
- ‘With disability’ refers to SHS clients who have core activity limitation. ‘Without disability’ may include clients who have disability but no core activity limitation.
Source: AIHW 2023; see also Table SHSC3, Data tables – Homelessness services. View data tables
Indigenous status
About 1 in 4 (24% or 5,900) clients with disability identify as Aboriginal and/or Torres Strait Islander (First Nations) people, compared with 30% (or 64,000) of clients without disability (of those with known Indigenous status).
First Nations clients (7.9% or 5,900) are less likely to be identified as having disability than non-Indigenous clients (10% or 19,000). For 7.0% (or 5,200) of First Nations clients and 7.9% (or 14,600) of non-Indigenous clients the disability status was not known.
First Nations clients with disability are about as likely to have severe or profound disability (30% or 1,800) as non-Indigenous clients with disability (29% or 5,500).
Beginning of support
In 2022–23, clients with disability (48% or 11,700) were as likely as those without disability (47% or 97,600, for those with known disability status) to be homeless, rather than at risk of homelessness, when they started receiving support (Figure HOMELESSNESS.2).
Housing status of SHS clients
All clients of specialist homelessness services are either homeless or at risk of homelessness (excluding clients who do not provide sufficient information to make this assessment). Housing circumstances are based on the client's type of residence, tenure, and conditions of occupancy.
‘Homeless’ includes people who:
- have no shelter or live in improvised / inadequate dwelling
- stay in short-term, temporary accommodation
- are a couch surfer or have no tenure in a house, townhouse or flat.
‘At risk of homelessness’ (also referred to as ‘housed’) includes people who:
- rent or live rent free in public or community housing
- rent, live rent free or own private or other housing
- reside in institutional settings.
This report looks at housing status at the beginning and the end of the client’s support.
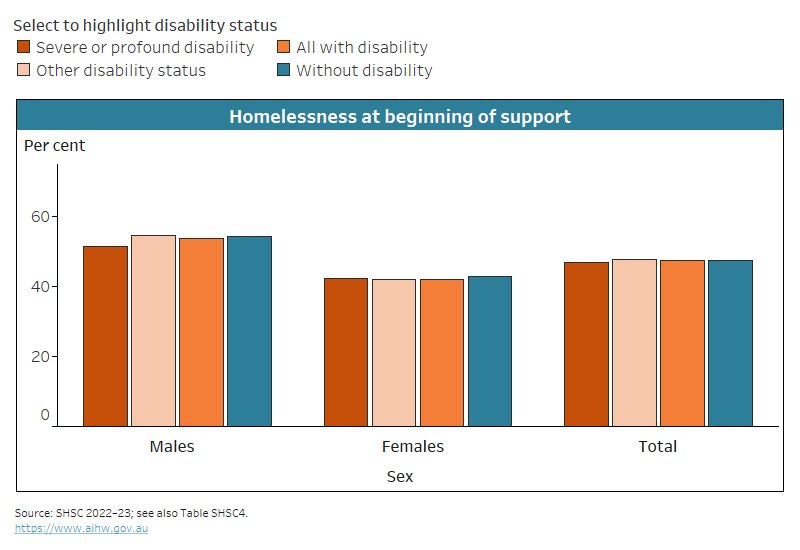
Male SHS clients with disability (54% or 6,200) are more likely than female clients (42% or 5,500) to be homeless when they start receiving support (for those with known disability and housing status). A similar pattern is evident in clients without disability (Figure HOMELESSNESS.2).
Figure HOMELESSNESS.2: Proportions of SHS clients homeless at the beginning of support, by disability status and severity, and sex, 2022–23
The chart shows that male SHS clients (with or without disability) are more likely to be homeless at the beginning of support than females.
Note: ‘With disability’ refers to SHS clients who have core activity limitation. ‘Without disability’ may include clients who have disability but no core activity limitation.
Source data tables: Data tables – Homelessness services. View data tables
Reasons for seeking assistance
The most common main reason SHS clients with disability seek support is due to problems with accommodation (43% or 11,100), followed by interpersonal relationships (20% or 5,300) (Table HOMELESSNESS.3).
Reasons for seeking assistance
The SHSC collects information about the client's reasons for seeking assistance at the start of support:
- the main reason for seeking support
- all reasons for seeking support.
This information is as reported by the client, not the agency worker.
Main reason | With disability | Without disability |
|---|---|---|
Accommodation | 42.9 | 35.2 |
Housing crisis | 24.7 | 20.1 |
Inadequate/inappropriate dwelling conditions | 14.1 | 11.0 |
Previous accommodation ended | 4.0 | 4.1 |
Interpersonal relationships | 20.4 | 31.6 |
Domestic/family violence | 15.3 | 25.4 |
Relationship/family breakdown | 3.3 | 4.3 |
Financial | 18.6 | 19.3 |
Financial difficulties | 9.9 | 10.7 |
Housing affordability stress | 8.5 | 8.1 |
Health | 6.1 | 2.4 |
Mental health issues | 2.7 | 1.2 |
Medical issues | 2.7 | 0.6 |
Notes:
- Denominator includes clients whose main reason for seeking support is recorded as ‘not stated’ (0.5% of clients with disability and 0.4% of clients without disability).
- ‘With disability’ refers to SHS clients who have core activity limitation. ‘Without disability’ may include clients who have disability but no core activity limitation. Excludes clients whose disability status is recorded as missing or unknown.
Source: AIHW 2023; see also Table SHSC5, Data tables – Homelessness services. View data tables
The main reasons clients seek support vary between those with and without disability (Table HOMELESSNESS.3). Clients with disability are more likely to report housing crisis as a main reason for seeking support and less likely to report domestic or family violence (Table HOMELESSNESS.3).
The main reasons that clients with disability seek support also vary depending on their housing situation at the beginning of support (Table HOMELESSNESS.4). For example:
- More than half (53% or 6,200) of clients with disability who are homeless when they begin support cite accommodation-related reasons as their main reason for seeking support, compared with about one-third (36% or 4,600) of those who begin support at risk of homelessness.
- Interpersonal relationship and financial issues are more commonly identified by clients with disability who begin support at risk of homelessness than those who begin support homeless.
Main reason | Homeless at first report | At risk at first report |
|---|---|---|
Accommodation | 53.0 | 35.8 |
Housing crisis | 26.7 | 23.9 |
Inadequate/inappropriate dwelling conditions | 20.6 | 9.1 |
Previous accommodation ended | 5.7 | 2.7 |
Interpersonal relationships | 16.8 | 21.8 |
Domestic/family violence | 11.1 | 17.1 |
Relationship/family breakdown | 4.2 | 2.5 |
Financial | 15.2 | 22.1 |
Financial difficulties | 6.5 | 12.9 |
Housing affordability stress | 8.5 | 9.0 |
Health | 4.9 | 7.5 |
Mental health issues | 2.5 | 2.9 |
Medical issues | 1.6 | 3.8 |
Notes:
- Denominator includes clients whose main reason for seeking support is recorded as ‘not stated’ (0.5% of clients with disability).
- ‘With disability’ refers to SHS clients who have core activity limitation.
Source: AIHW 2023; see also Table SHSC6, Data tables – Homelessness services. View data tables
During support
Clients with disability generally have a higher and more complex need for support than clients without disability. This is reflected in:
- higher average number of support periods received – 2.4 for clients with disability compared with 1.7 for clients without disability
- greater median length of support – 81 days compared with 56
- higher average number of distinct services needed – 12.4 compared with 8.8 (AIHW 2023).
Support need and provision
Information on services and assistance needed, provided and referred is collected by SHS agencies during the collection period.
‘Services needed’ refers to services or assistance the SHS agency worker assesses the client needs, regardless of whether the client accepts this or agrees to participate in the support service.
‘Services provided’ refers to services or assistance provided directly by the SHS agency.
‘Services referred’ refers to cases where a client is referred to another service provider who accepts the client for an appointment or interview. It does not capture whether a client kept the appointment or whether the appointment led to the client receiving a service.
Type of support needed
Accommodation provision is the most needed type of assistance for clients with (68% or 17,500) and without (62% or 138,000) disability (for SHS clients with known disability status). Clients with disability, however, generally have a higher need for all types of accommodation (multiple accommodation needs may be identified):
- 45% (or 11,600) need long-term housing, compared with 42% (or 93,200)
- 38% (or 9,800) need medium-term or transitional housing, compared with 30% (or 67,900)
- 51% (or 13,300) need short-term or emergency accommodation, compared with 40% (or 90,100) (AIHW 2023).
Other common types of assistance needed by SHS clients with known disability status include:
- assistance to sustain housing tenure – 38% (or 9,900) of clients with disability, compared with 31% (or 70,000) of clients without disability
- mental health assistance – 16% (or 4,100), compared with 9.0% (or 20,200)
- legal or financial services – 7.8% (or 2,000), compared with 6.2% (or 13,900)
- family assistance (including child protection, parenting skills, and child specific counselling services) – 7.3% (or 1,900), compared with 8.6% (or 19,300)
- immigration or cultural services assistance – 7.0% (or 1,800), compared with 6.9% (or 15,400)
- disability services – 5.8% (or 1,500), compared with 1.1% (or 2,500) (clients without disability who are identified to need disability services may include people who have disability but no core activity limitation)
- drug and alcohol services – 5.5% (or 1,400), compared with 3.0% (or 6,600) (AIHW 2023).
Almost all SHS clients also need some general assistance, such as advice or information (86% or 22,200 of all SHS clients with disability in 2022–23), advocacy (67% or 17,300), or material aid (43% or 11,200). Clients with disability are generally more likely than those without disability to need most types of assistance, with the exception of assistance for domestic and/or family violence (20% or 5,100 of clients with disability and 26% or 57,800 of clients without disability needed this type of assistance) (AIHW 2023).
Unmet need for support
Not all SHS clients who need support receive it directly from SHS service provider (though they may have a referral arranged). As a result, not all clients have their support needs met.
In 2022–23, of SHS clients with known disability status:
- 34% (or 8,800) of clients with disability had all their support needs met directly, compared with 43% (or 96,700) without disability
- 62% (or 16,200) had some needs met, compared with 52% (or 116,000)
- 3.5% (or 900) had none of their needs met, compared with 4.7% (or 10,500) (AIHW 2023).
Some types of support are more likely to be provided than others. For example, of SHS clients with disability:
- half (50% or 8,700) of those who needed accommodation were provided it directly and a further 18% (or 3,100) were referred elsewhere
- 81% (or 7,900) of those who needed assistance to sustain housing tenure received that assistance directly and a further 3.2% (or 315) were referred
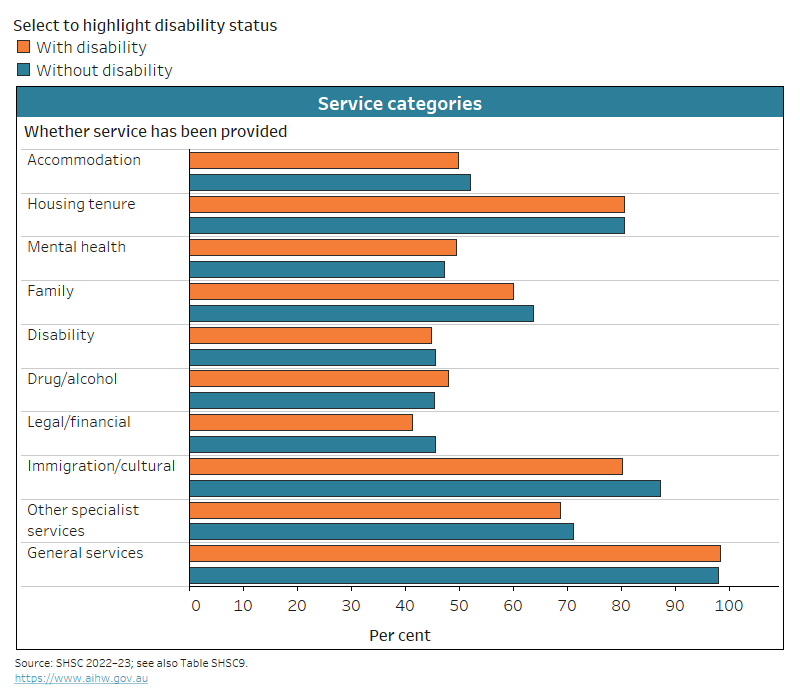
- 4 in 10 (41% or 835) who needed legal or financial services received them directly and a further 28% (or 560) were referred (Figure HOMELESSNESS.3, AIHW 2023).
Clients with disability (50% or 8,700) are slightly less likely than clients without disability (52% or 71,600) to receive the accommodation services they need, and slightly more likely to receive long-term housing (5.9% or 780 compared with 4.0% or 3,600) when they need it.
When they need them, clients with disability are also more likely to receive:
- mental health services – 49% (or 2,000) compared with 47% (or 9,500)
- drug and/or alcohol services – 48% (or 680) compared with 45% (or 3,000) (AIHW 2023).
When they need them, clients with disability are less likely to receive:
- immigration and/or cultural services – 80% (or 1,500) compared with 87% (or 13,400)
- family services – 60% (or 1,100) compared with 64% (or 12,300)
- legal and/or financial – 41% (or 840) compared with 46% (or 6,300)
- other specialist (including health and medical services) – 69% (or 4,600) compared with 71% (or 28,500) (AIHW 2023).
Clients with disability and without disability have similar rates of direct service provision for:
- assistance to sustain housing tenure – 81% (or 7,900) of clients with disability and 81% (or 56,400) of clients without disability
- general services (including employment and training assistance) – 98% (or 24,300) and 98% (or 205,000) (AIHW 2023).
Figure HOMELESSNESS.3: Proportion of SHS clients who received the services they needed, by service category and disability status, 2022–23
The chart shows that lower proportions of clients with disability received certain services (family, legal, or cultural), than without disability.
Notes:
- ‘With disability’ refers to SHS clients who have core activity limitation. ‘Without disability’ may include clients who have disability but no core activity limitation. Excludes clients whose disability status is recorded as missing or unknown.
- All services listed in the chart except ‘General services’ are considered specialist services. ‘Other specialist services’ include health/medical services, specialist counselling services, and other specialised services not included elsewhere.
Source data tables: Data tables – Homelessness services. View data tables
End of support
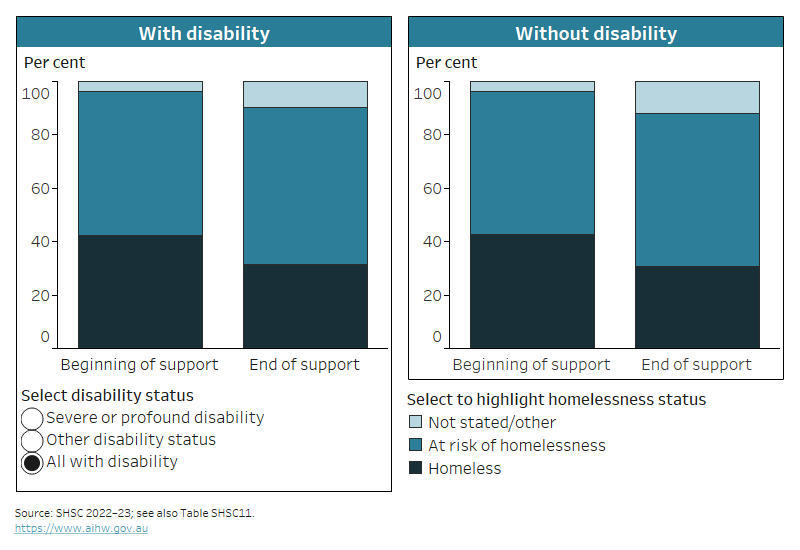
Housing outcomes for clients with disability generally improve following support, with fewer being homeless when they leave support.
Four in 10 (42% or 7,200) clients with disability are homeless when they start support, compared with 3 in 10 (31% or 5,390) at the end of support (for SHS clients with closed support period). The pattern is similar for clients with severe or profound disability (40% or 1,975 homeless at the beginning or support and 29% or 1,435 at the end) and clients without disability (41% or 67,000 homeless at the beginning of support and 31% or 50,000 at the end) (Figure HOMELESSNESS.4, AIHW 2023).
Figure HOMELESSNESS.4: Homelessness status at the beginning and end of support for SHS clients with closed support periods, by disability status and severity, 2022–23
The chart shows that 31% of people with disability were homeless at the end of SHS support, compared with 42% at the beginning of support.
Notes:
- ‘With disability’ refers to SHS clients who have core activity limitation. ‘Without disability’ may include clients who have disability but no core activity limitation. Excludes clients whose disability status is recorded as missing or unknown.
- SHS clients are assessed as either homeless or at risk of homelessness; clients who do not provide enough information to make this assessment are recorded as ‘Not stated/other’.
Source data tables: Data tables – Homelessness services. View data tables
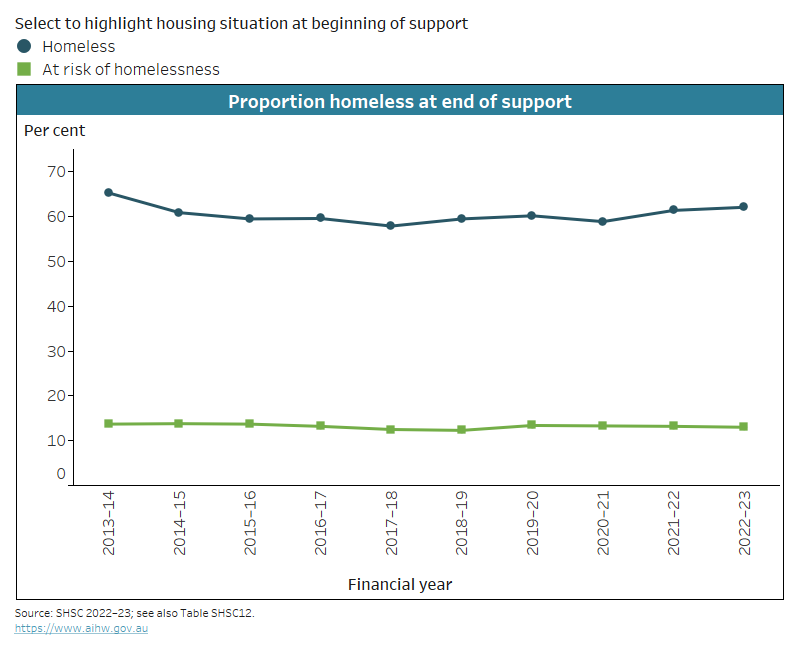
Figure HOMELESSNESS.5: Proportion of SHS clients with disability homeless at end of support, by housing situation at the beginning of support, 2013–14 to 2022–23
The chart shows that, in 2022–23, 62% of clients with disability who started their support homeless had ended their support period also homeless.
Notes:
- ‘With disability’ refers to SHS clients who have core activity limitation.
- Proportions include only clients with closed support and for whom housing status is known at first report and at end of support.
- The SHSC classifies clients as ‘homeless’ if they are living with no shelter or an improvised or inadequate dwelling, in short-term temporary accommodation, or in a house, townhouse or flat with relatives (rent free). It classifies clients as ‘at risk of homelessness’ (‘housed’) if they are living in public or community housing (renter or rent free), private or other housing (renter or rent free), or in institutional settings.
- From 2023, clients with an unknown tenure and an occupancy condition which is ‘Not applicable’, ‘Other’ or ‘Unknown’ are considered as having a status of ‘Not stated‘ rather than ’At risk – Other‘. The historical data in this figure has been back-cast with the change applied. This has resulted in a reduction in the number of ’At risk‘ clients.
- Data for 2013–14 to 2016–17 have been adjusted for non-response. Due to improvements in the rates of agency participation and SLK validity, data from 2017–18 are not weighted. The removal of weighting does not constitute a break in time series, and weighted data from 2013–14 to 2016–17 are comparable with unweighted data for 2017–18 onwards.
Source data tables: Data tables – Homelessness services. View data tables
The homelessness status at the end of support varies by the housing situation at the start of support. Clients with disability who begin support homeless are more likely to be homeless at the end of support (57% or 4,100) than those who begin support at risk of homelessness (12% or 1,000) (for SHS clients with closed support period) (AIHW 2023). Clients with severe or profound disability who begin support homeless are less likely to remain homeless at the end of support (53% or 1,100) than clients with other disability status (58% or 3,000) or clients without disability (60% or 40,200) (AIHW 2023).Between 2013–14 and 2017–18/2018–19, there have been some improvements in how likely people with disability are to be housed following support, however the improvements did not continue in the more recent years (Figure HOMELESSNESS.5).
Risk factors
Disability is considered one of the risk factors for experiencing homelessness. Clients with disability are also more likely than clients without disability to have one or more other risk factors that increase their likelihood of experiencing homelessness, or that provide additional barriers to exiting homelessness, such as (for SHS clients aged 10 and over with known disability status):
- mental health issues – 60% (or 14,300) compared with 36% (or 68,100)
- drug or alcohol misuse – 17% (or 3,900) compared with 10% (or 18,800) (AIHW 2023).
Clients with disability are less likely than clients without disability to be identified as having experienced domestic and family violence (31% or 8,100 compared with 39% or 86,700) (AIHW 2023).
Clients with disability are more likely to experience repeat homelessness. Among SHS clients with disability who have experienced homelessness sometime during 2022–23, 7.8% (or 1,200) experienced repeat homelessness, compared with 4.7% (or 5,900) clients without disability (AIHW 2023).
What is repeat homelessness?
In this report, clients who have transitioned from being homeless to being housed and back to being homeless again within a financial year are considered to have experienced ‘repeat homelessness’.
The SHSC captures only people who use SHS services. There may be people SHS services have helped into housing who became homeless again but who did not return to SHS services.
What are mental health issues?
The SHSC identifies a client as having a mental health issue if they are aged 10 or over and have provided any of the following information in any support period during the reporting period:
- they have reported ‘Mental health issues’ as a reason for seeking assistance, or main reason for seeking assistance
- at some stage during their support period, a need was identified for psychological services, psychiatric services, or mental health services (as determined by a need for such services being recorded for the client, a relevant service being provided to the client and/or the client being referred for such a service)
- their formal referral source to the specialist homelessness agency was a mental health service
- they are currently receiving services or assistance for their mental health issues or have in the last 12 months
- they have been in a psychiatric hospital or unit in the last 12 months
- their dwelling type either a week before presenting to an agency, or when presenting to an agency, was a psychiatric hospital or unit.
Where can I find out more?
- Data tables for this report.
- This section looks at SHS clients with disability (core activity limitation). Annual reports from the SHSC generally focus on the subset of clients with severe or profound disability. More information on the AIHW website: SHSC and latest reports page.
AIHW (Australian Institute of Health and Welfare) (2022) Specialist homelessness services annual report 2021–22, AIHW, accessed 17 October 2023.
AIHW (2023) Specialist Homelessness Services Collection (SHSC) 2022–23, AIHW, customised data request.


