Breathing difficulties (abnormalities of breathing)
Because of the association between air pollution from bushfires and respiratory conditions, hospitalisations with a principal diagnosis of abnormalities of breathing (ICD-10-AM codes R06.0–R06.8), henceforth referred to as breathing difficulties, were analysed.
Analyses did not identify a consistent pattern in relation to impacts from bushfires and hospitalisations due to breathing difficulties.
Nationally, there were increases in the hospitalisation rate for breathing difficulties across each week of the 2019—20 bushfire season. The greatest increase during times of increased fires, was 41% in the week beginning 19 January 2020—3.5 per 100,000 persons (about 890 hospitalisations), compared with the previous 5-year average of 2.5 per 100,000 (an average of 610 hospitalisations).
To explore national data and data for states and territories, see interactive data visualisations below (for data tables see Supplementary table S1).
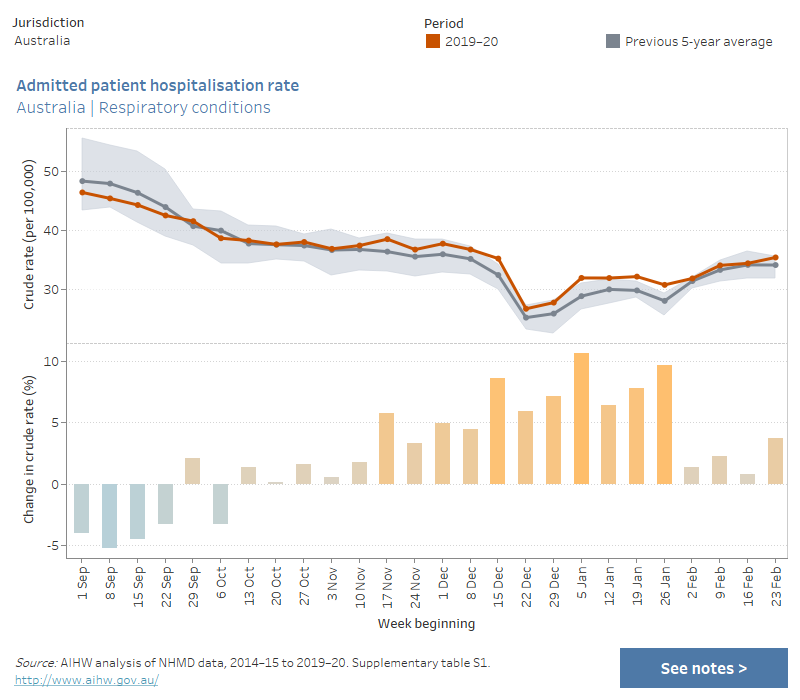
Admitted patient hospitalisation rate, by jurisdiction, breathing difficulties (ICD-10-AM codes R06.0–R06.8), weeks in 2019–20 bushfire season relative to previous 5-year average
This combined chart shows the crude rate of admitted patient hospitalisations (per 100,000 persons) for breathing difficulties for the periods 2019–20 and the previous 5-year average, and the percentage change in crude rate between the two periods. Data are presented by jurisdiction and by week, for the period 1 September to 29 February/1 March, which correspond to the bushfire season. The chart shows that nationally, compared with the previous 5-year average, there were increases in the hospitalisation rate across each week of the 2019—20 bushfire season. There were also variations at the jurisdictional level.

At the state and territory level, examples of large increases in the hospitalisation rate for breathing difficulties coinciding with periods of significant fire activity or air pollution include:
- a 53% increase in the week beginning 19 January 2020 for Victorian residents—4.5 per 100,000 persons (about 295 hospitalisations), compared with an average of 2.9 per 100,000 in the previous 5-year period (an average of about 185 hospitalisations). Extremely high PM2.5 levels were recorded across the state in the week before (see Arriagada et al. 2020; supplementary material).
- a 99% increase in the week beginning 29 December 2019 for South Australian residents—2.1 per 100,000 persons (37 hospitalisations), compared with an average of 1.1 per 100,000 in the previous 5-year period (an average of 18 hospitalisations). This coincided with multiple new fires starting on Kangaroo Island, the Eyre Peninsula and the Lower South East (Government of South Australia 2020).
Because the numbers of hospitalisations for breathing difficulties at the level of Statistical Area Level 4 (SA4) were generally small, data are not presented at this level.
For data by Statistical Area Level 4 (SA4), see Supplementary table S2.
References
Arriagada NB, Palmer AJ, Bowman DM, Morgan GG, Jalaludin BB & Johnston FH 2020. Unprecedented smoke-related health burden associated with the 2019–20 bushfires in eastern Australia. Medical Journal of Australia 213(6): 282–3.
Government of South Australia 2020. Independent review into South Australia’s 2019–20 bushfire season.


