Asthma
While asthma was included in the analysis of all respiratory conditions, emergency department presentations with a principal diagnosis of asthma (ICD-10-AM codes J45–J46) were also analysed separately due to the known association with air pollution from bushfires (see Australian bushfires 2019–20: exploring the short-term health impacts).
Nationally, the greatest increase in the asthma presentation rate was 44% in the week beginning 12 January 2020—4.7 per 100,000 persons (about 1,200 presentations), compared with 3.3 per 100,000 in the previous bushfire season (about 820 presentations). The week beginning 5 January 2020 saw a similar increase in the rate of presentations.
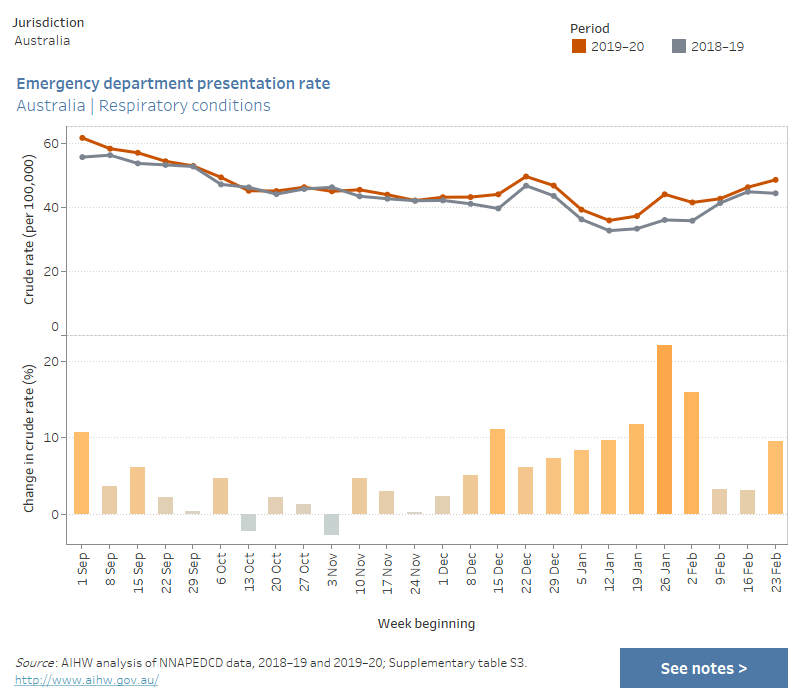
To explore national data and data for states and territories, see interactive data visualisations below (for data tables see Supplementary table S3).
Emergency department presentation rate, by jurisdiction, asthma (ICD-10-AM codes J45–J46), weeks in 2019–20 bushfire season relative to previous year
This combined chart shows the crude rate of emergency department presentations (per 100,000 persons) for asthma for the periods 2019–20 and 2018–19, and the percentage change in crude rate between the two periods. Data are presented by jurisdiction and by week, for the period 1 September to 29 February/1 March, which correspond to the bushfire season. The chart shows that nationally, compared with the previous year, the greatest increase in the presentation rate was 44% in the week beginning 12 January 2020. There were also variations at the jurisdictional level.

At the state and territory level, examples of large increases in the presentation rate of asthma coinciding with periods of significant fire activity or air pollution include:
- a 54% increase in the week beginning 8 December 2019 for New South Wales residents—8.3 per 100,000 persons (about 670 presentations), compared with 5.4 per 100,000 in the previous bushfire season (about 425 presentations)
- an increase of around 125% in the week beginning 12 January 2020 for Victorian residents—7.4 per 100,000 persons (about 485 presentations), compared with 3.3 per 100,000 in the previous bushfire season (about 215 presentations)
- an increase of around 230% in the week beginning 29 December 2019 for Australian Capital Territory residents—13 per 100,000 persons (57 presentations), compared with 4.0 per 100,000 in the previous bushfire season (17 presentations).
At the level of Statistical Area Level 4 (SA4), examples of large increases in the presentation rate for asthma coinciding with periods of significant fire activity or air pollution include:
- an increase of around 300% in the week beginning 10 November 2019 for Mid North Coast residents—29 per 100,000 persons (65 presentations), compared with 7.3 per 100,000 (16 presentations) in the previous bushfire season. A similar increase was observed for the week beginning 17 November 2019. Each of these weeks coincided with extremely high PM2.5 measurements at the nearby Port Macquarie air quality monitoring station.
- an increase of around 135% in the week beginning 12 January 2020 for Latrobe-Gippsland residents—15 per 100,000 persons (43 presentations), compared with 6.4 per 100,000 in the previous bushfire season (18 presentations). This coincided with the time in which bushfires burned at emergency warning levels around the NSW and Victoria border.
For data by Statistical Area Level 4 (SA4), see Supplementary table S4.


