Mental health-related conditions
The effects of bushfire are associated with mental health impacts (Gibbs et al. 2016; Laugharne et al. 2011). Consequently, some people’s mental health care needs may require presentation to an emergency department. Therefore, presentations with a principal diagnosis for mental health-related conditions (ICD-10-AM codes F00–F99), were analysed.
Nationally, the presentation rate for mental health-related conditions was generally higher for most weeks throughout the 2019–20 bushfire season, compared with the previous bushfire season. It is not clear to what extent this increase was related to the effects of the bushfires or to other factors.
To explore national data and data for states and territories, see interactive data visualisations below (for data tables see Supplementary table S3).
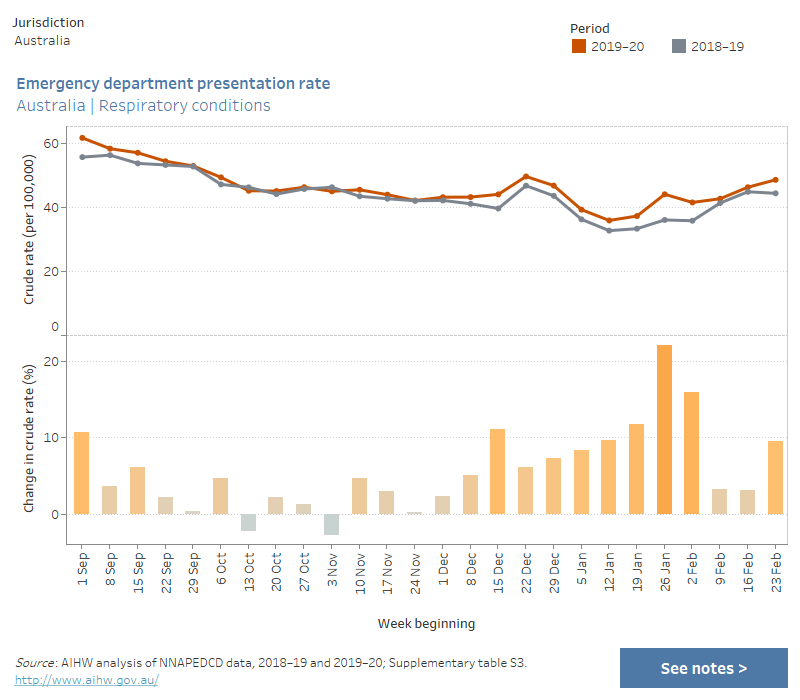
Emergency department presentation rate, by jurisdiction, mental health-related conditions (ICD-10-AM codes F00–F99), weeks in 2019–20 bushfire season relative to previous year
This combined chart shows the crude rate of emergency department presentations (per 100,000 persons) for mental health-related conditions for the periods 2019–20 and 2018–19, and the percentage change in crude rate between the two periods. Data are presented by jurisdiction and by week, for the period 1 September to 29 February/1 March, which correspond to the bushfire season. The chart shows that nationally, compared with the previous year, the presentation rate was generally higher for most weeks throughout the 2019–20 bushfire season. There were also variations at the jurisdictional level.

The presentation rates for mental health-related conditions varied across states and territories. Most states and territories generally had higher rates throughout the 2019–20 bushfire season compared with the previous bushfire season, particularly in weeks of, or surrounding, when bushfires were burning (although the interaction with other factors such as COVID–19 and damaging storms might have affected increases). Examples of increases in the presentation rate for mental health-related conditions included:
- a 35% increase in the week beginning 26 January 2020 for Australian Capital Territory residents—24 per 100,000 persons (about 105 presentations), compared with 18 per 100,000 in the previous bushfire season (75 presentations)
- a 22% increase in the week beginning 9 February 2020 for South Australian residents—32 per 100,000 persons (about 560 presentations), compared with 26 per 100,000 in the previous bushfire season (450 presentations)
- a 21% increase in the week beginning 5 January 2020 for Queensland residents—27 per 100,000 persons (about 1,400 presentations), compared with 22 per 100,000 in the previous bushfire season (about 1,100 presentations).
Conversely, presentation rates for mental health-related conditions among New South Wales residents were generally lower across the 2019–20 bushfire season. However, there were regional variations.
At the level of Statistical Area Level 4 (SA4), examples of increases in the presentation rate for mental health-related conditions coinciding with periods of significant fire activity or air pollution include:
- a 60% increase in the week beginning 29 December 2019 for Capital Region residents—73 per 100,000 persons (about 170 presentations), compared with 46 per 100,000 in the previous bushfire season (about 105 presentations). Bushfire had an impact on large parts of this SA4 for an extended period, particularly during December 2019 and January 2020
- about a 120% increase in the week beginning 19 January 2020 in presentation rates for South Australia–South East residents—33 per 100,000 persons (64 presentations), compared with 15 per 100,000 in the previous bushfire season (29 presentations). This SA4 included Kangaroo Island, much of which was burnt by bushfire.
For data by Statistical Area Level 4 (SA4), see Supplementary table S4.
References
Gibbs L, Bryant R, Harms L, Forbes D, Block K, Gallagher HC et al. 2016. Beyond bushfires: community resilience and recovery: final report. Melbourne: University of Melbourne.
Laugharne J, Van de Watt G & Janca A 2011. After the fire: the mental health consequences of fire disasters. Current Opinions in Psychiatry 24(1):72–7.


