Burns
Hospitalisations with a principal diagnosis categorised as burns (ICD-10-AM codes T20–T31) were analysed.
Overall, the rate of hospitalisations for burns in Australia is generally low. There were fluctuations in hospitalisation rates—likely due to small numbers—observed during the periods analysed. Therefore, the following results should be interpreted with caution.
Nationally, there were increases in the hospitalisation rate for burns coinciding with increased bushfire activity during the 2019—20 bushfire season. The greatest increase in the hospitalisation rate was 30% in the week beginning 15 December 2019—0.8 per 100,000 persons (about 210 hospitalisations), compared with the previous 5-year average of 0.6 per 100,000 (an average of 155 hospitalisations). The week beginning 29 December 2019 also saw a 13% increase in the rate of hospitalisations. The extent to which these hospitalisations were directly related to bushfire is unknown; however, this timing coincides with periods of intense fire activity.
To explore national data and data for states and territories, see interactive data visualisations below (for data tables see Supplementary table S1).
Admitted patient hospitalisation rate, by jurisdiction, burns (ICD-10-AM codes T20–T31), weeks in 2019–20 bushfire season relative to previous 5-year average
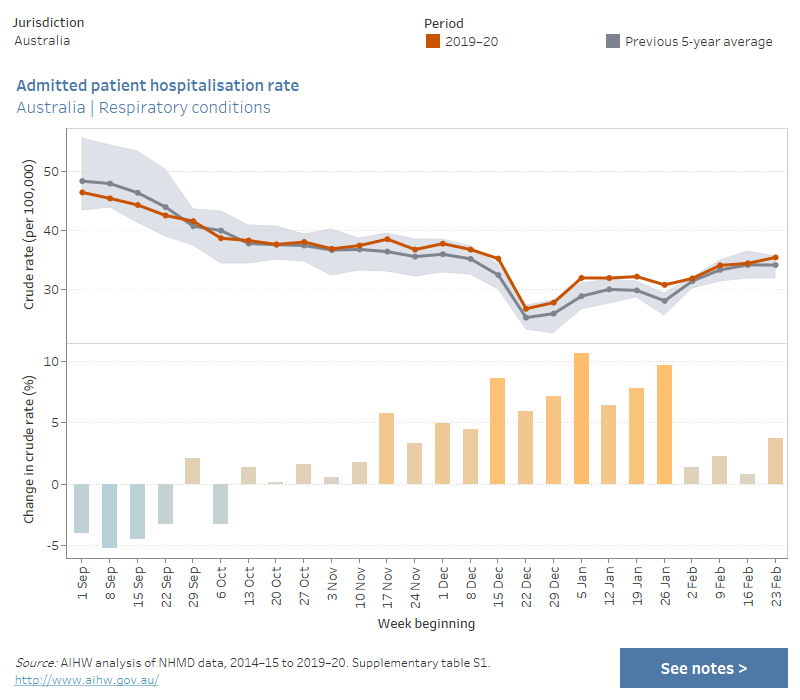
This combined chart shows the crude rate of admitted patient hospitalisations (per 100,000 persons) for burns for the periods 2019–20 and the previous 5-year average, and the percentage change in crude rate between the two periods. Data are presented by jurisdiction and by week, for the period 1 September to 29 February/1 March, which correspond to the bushfire season. The chart shows that nationally, compared to the previous 5-year average, the greatest increase in the hospitalisation rate was 30% in the week beginning 15 December 2019. There were also variations at the jurisdictional level.

At the state and territory level, there was a 160% increase in the week beginning 15 December 2019 for South Australian residents—1.9 per 100,000 persons (34 hospitalisations), compared with an average of 0.7 per 100,000 in the previous 5-year period (an average of 13 hospitalisations). During the same week, there was intense fire activity driven by extremely hot temperatures, strong winds and dry lightning strikes on 20 December 2020, with the Cudlee Creek fire (Adelaide Hills) and the Duncan and Menzies fires (Kangaroo Island) the most significant; 51 firefighter injuries resulted from the Cudlee Creek fire (Government of South Australia 2020).
Because the numbers of hospitalisations for burns at the level of Statistical Area Level 4 (SA4) were generally small, data are not presented at this level.
For data by Statistical Area Level 4 (SA4), see Supplementary table S2.
References
Government of South Australia 2020. Independent review into South Australia’s 2019–20 bushfire season.


