Summary
Geography and time-specific data for environmental analysis
This release contains up to 20 years of weekly data of health service use relating to specific health conditions by geographic area (Statistical Area 4 – SA4). Data are presented for respiratory, cardiovascular, and mental health conditions, including:
- hospitalisations (2002–03 to 2021–22)
- hospital emergency department presentations (2014–15 to 2021–22)
- Medicare Benefits Schedule service claims (2002–03 to 2021–22)
- Pharmaceutical Benefits Scheme (PBS) and Repatriation Pharmaceutical Benefits Scheme (RPBS) prescriptions dispensed (2002–03 to 2021–22).
The data set also includes hospitalisations and emergency department visits for other health conditions (burns, dehydration, eye conditions, diabetes, chronic kidney disease, fractures, and cellulitis).
This data set was compiled to facilitate research on the impact of environmental events (in particular, bushfire) on health service use. The data are presented by week and SA4 to allow for geographic and time-specific analysis of variation in health service use, while maximising the amount of data that can be released. Finer disaggregation by time or geography leads to substantially more data points needing to be omitted from the data set for reasons relating to privacy and confidentiality (most notably – small numbers).
For further information on the data sources and how the data have been grouped and structured see Technical notes.
Considerations for use of the data
Variation in the data items over time and across jurisdictions will be evident due to a wide range of factors – both fundamental (for example, differing demographics, shifts in policies, changing markets for health service provision), and methodological in nature (for example, changing data coding schemas and practices over time).
The health service use data are based on administrative records and there are considerations that users should be aware of when using or viewing the data, including:
- The definitions differ from those used elsewhere for reporting purposes. Key differences for this data set include:
- date of hospitalisation is based on admission date instead of separation date
- geographical areas associated with the data represent place of residence rather than place of service provision
- some areas of Australia have been excluded such as other territories and records that do not map to a geographical area.
- The data provide a partial snapshot of service provision for any particular condition and only show need that has been met. For example, natural disasters may affect people’s ability to reach services or the ability for services to operate normally, and in general, due to capacity constraints, the health system may not immediately be able to satisfy a surge in need. People may stay home to avoid exposure to environmental hazards (for example, bushfire smoke or flood waters). See also the explanation of Figure 1 in relation to clinical and sub-clinical effects.
- The data are administrative and therefore can be subject to a range of factors such as variation in administrative processes, or changes in policy, diagnosis codes or diagnosis coding practices.
- The data may not be appropriate or suitable for understanding patterns in health service requirements or prevalence over time and by geography due to the issues described above.
- Data custodians apply a range of rules and principles in order to protect privacy and confidentiality. Therefore, certain data may be denoted as ‘not presented’ (n.p.).
For detail on the data's construction by data set and other important considerations for using the data (including changes to scope and data definitions over time), see Technical notes.
Environmental health analysis
As the impacts of climate and environmental change are increasingly felt throughout Australia, and worldwide, there is a need to better understand the influence of environmental factors on human health. The aim of this project is to provide a publicly available, accessible data set that will allow researchers and other practitioners (such as people working in the areas of health service planning, disaster resilience and response or public health policy) to better understand how environmental events may influence health outcomes or health service use. The project is part of an Australian Research Data Commons (ARDC) Bushfire Data Challenges program.
This release contains health service use data for health conditions that are potentially associated with or exacerbated by bushfire and bushfire smoke impact. Some of this health service use may be bushfire-related, but likely only a portion for any particular data item, and only in particular places at particular points in time. There is no information in the data that directly indicates that the health service use is related to bushfire events, and this causal attribution is to be examined by researchers in future projects. However, researchers may be able to use these data in conjunction with environmental data (for example, bushfire smoke data or temperature data) to derive insights about health service use coinciding with particular events, and to help identify topics for more detailed study.
The data only provide a partial picture of health. Figure 1 (sourced from Melody and Johnston 2015) illustrates that the largest proportion of people who experience impacts from bushfire smoke and airborne particulate matter may not have significant symptoms or may not visit a health professional. In addition, the data are reflective of health services provided and not the unmet need which may exist. Bushfires and other environmental events can be disruptive to health service facilities and staffing and may require people to move from their usual address.
While most of the data have been grouped according to conditions that have been associated with bushfire impacts in the scientific literature, or that could potentially be associated with the impacts of bushfire or bushfire smoke, it is important to note that a range of factors can lead to increases or decreases in service use.
While the focus for this release is potentially bushfire-related data, there is also scope for using this geographic and time-specific data to examine other topics with appropriate methods.
Figure 1: The air pollution pyramid
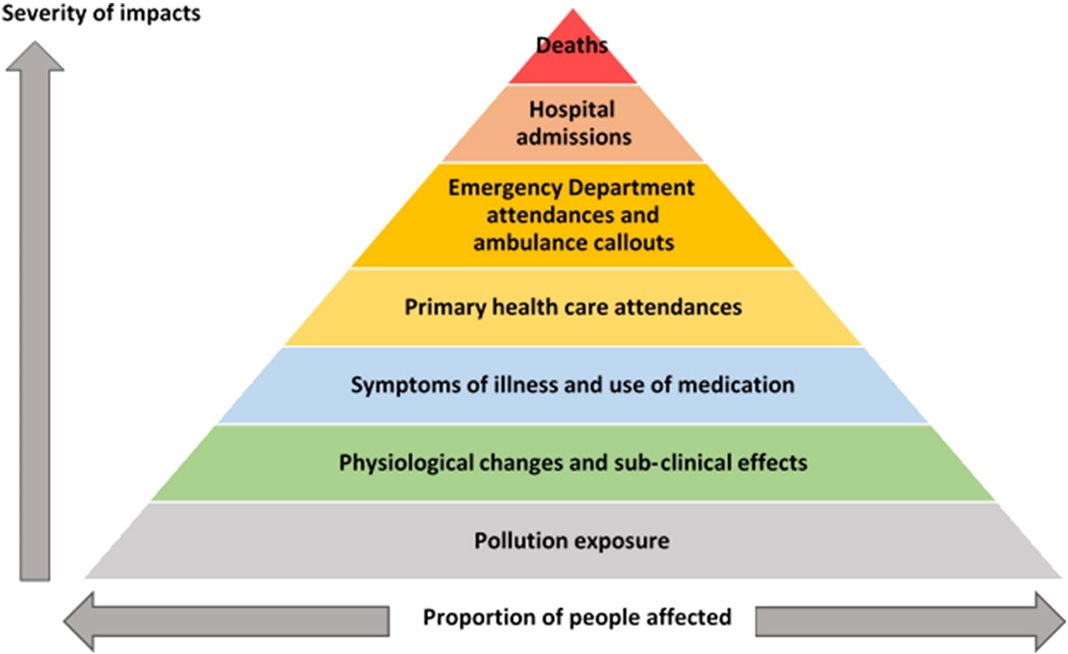
Source: Melody and Johnston 2015 (CC BY-NC-ND 4.0)
References
Cascio W (2018) ‘Wildland fire smoke and human health’, Science of the Total Environment, 624:586–95, doi:10.1016/j.scitotenv.2017.12.086.
Melody SM and Johnston FH (2015) ‘Coal mine fires and human health: What do we know?’, International Journal of Coal Geology, 115, Part B:1–14, doi:10.1016/j.coal.2015.11.001.