Hospitalisations data
About the data source
Hospitalisations data used in the construction of this data set were sourced from the National Hospital Morbidity Database (NHMD). Further information on the NHMD is available at Hospitals info & downloads: About the data and National Hospitals Data Collection. Earlier data quality statements are available online at Data quality statement: Admitted Patient Care 2017-18 and by following the relational attributes at this link to locate the superseded earlier data quality statements.
The NHMD is a compilation of episode-level records from admitted patient morbidity data collection systems in Australian hospitals.
The data supplied are based on the National Minimum Data Set (NMDS) for Admitted Patient Care and include demographic data, administrative data, as well as data on the diagnoses of the patients.
Methodology
In constructing this data set, hospitalisations were grouped by week (based on date of admission), geographical area (based on the patient’s place of usual residence), and principal diagnosis, for select groupings of interest. The derivation of these fields is described further below.
The data set reports a count measure, which reflects the total number of hospitalisations each week assigned a principal diagnosis falling within a given condition grouping, for a given geographical area. Counts represent the number of hospitalisations rather than the number of people.
The associated crude rate refers to the number of hospitalisations per 100,000 population. Rates were calculated by dividing the count data by the estimate of population for the relevant week and geographical area derived as described in Population data.
Note: In some cases, ‘statistical admissions’ arising from the commencement of a new episode of care, with a new care type, may occur for a patient within a single hospital stay.
Diagnosis groupings
The conditions (and associated ICD-10-AM codes) in Table 4 were selected for inclusion based on existing literature on the health impacts of bushfires and bushfire smoke pollution as well as subject matter expert advice.
In Australia, for the period relevant to this project, the International Statistical Classification of Diseases and Related Health Problems, Tenth Revision, Australian Modification (ICD-10-AM) was used to code diagnoses in the underlying source data.
The edition of the ICD-10-AM used to classify diagnoses in the source data varied over time as follows:
- 2002–03 and 2003–04: Third Edition
- 2004–05 and 2005–06: Fourth Edition
- 2006–07 and 2007–08: Fifth Edition
- 2008–09 and 2009–10: Sixth Edition
- 2010–11 to 2012–13: Seventh Edition
- 2013–14 and 2014–15: Eighth Edition
- 2015–16 and 2016–17: Ninth Edition
- 2017–18 and 2018–19: Tenth Edition
- 2019–20 to 2021–22: Eleventh Edition.
The data were mapped to the ICD-10-AM (11th edition) prior to aggregating into condition groups.
To capture acute hospitalisations, hospitalisations with a care type of acute care, newborn with qualified days only, newborn with qualified and unqualified days, and not reported/ unknown were included in the analysis. Additionally, hospitalisations with a care type of mental health were also included. Note that the mental health care type was introduced from 1 July 2015. For the 2002–03 financial year, the numeric code for unknown/not reported was 11.0. The code became 99.0 from 2004–05 onwards. The code of 11 was assigned to mental health from 1 July 2015 onwards. Care types that were excluded from the analysis include rehabilitation care, palliative care, geriatric evaluation and management, psychogeriatric care, maintenance care, other admitted patient care, organ procurement – posthumous, and hospital boarder.
| Condition group | ICD-10-AM, Eleventh Edition codes |
|---|---|
| Respiratory conditions | J00–J99 |
| Acute respiratory infection | J00–J22 |
Chronic lower respiratory conditions | J40–J47 |
Chronic obstructive pulmonary disease (COPD) with acute exacerbation | J44.1 |
Asthma | J45–J46 |
Heart, stroke, and vascular conditions | I00–I99 |
Selected heart conditions (hypertensive disease, coronary heart disease, pulmonary heart disease, and other forms of heart disease) | I10–I15, I20–I25, I26–I28, I30–I52 |
Coronary heart disease | I20–I25 |
Heart attack (acute myocardial infarction) | I21 |
Heart failure and cardiomyopathy | I50, I125.5, I42.0, I42.5–I42.9, I43 |
Atrial fibrillation and heart flutter | I48 |
Stroke | I60–I64 |
Mental and behavioural disorders | F00–F99 |
Mental and behavioural disorders due to psychoactive substance use | F10–F19 |
Mood (affective) disorders | F30–F39 |
Neurotic, stress-related and somatoform disorders | F40–F49 |
Diabetes mellitus | E10, E11, E13, E14, O24 |
Chronic kidney disease | E10.2, E11.2, E13.2, E14.2, I12, I13, I15.0, I15.1, N00–N08, N11, N12, N14–N16, N18, N19, N25–N28, N39.1, N39.2, D59.3, B52.0, E85.3, Q60–Q63, T82.4, T86.1, U87.1 |
Dehydration | E86 |
Burns | T20–T31 |
Fractures | S02, S12, S22, S32, S42, S52, S62, S72, S82, S92, T02, T08, T10, T12, T14.2 |
Eye conditions | H00–H59 |
Cellulitis | L03 |
A representation of how the items are related is shown in Figure 6.
Figure 6: Representation of relationship between condition groupings in hospitals data
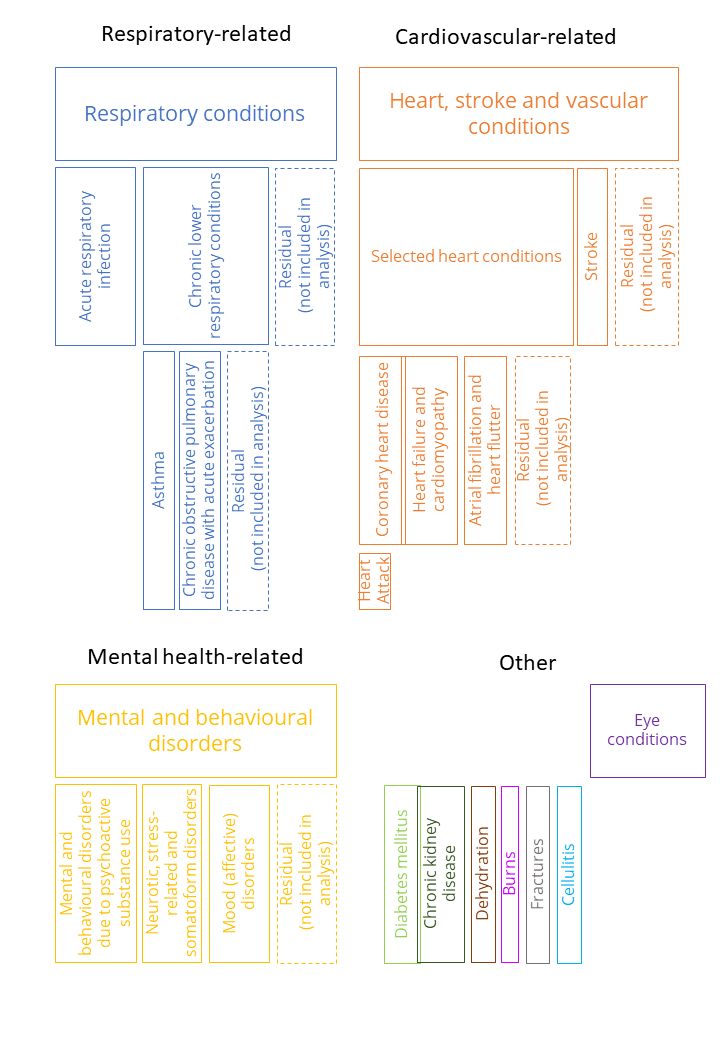
Note: The size of the boxes does not reflect the number of hospitalisations or presentations associated with each condition group.
Analysis by week
Presentations are grouped by week (Monday–Sunday) based on date of admission. The weeks form a continuous time series over the temporal extent of the data set.
Analysis by geography
Analysis at the SA4 level was based on the patient’s usual area of residence (not the SA4 of the hospital at which the patient was admitted).
Data in the NHMD were supplied by jurisdictions to the AIHW. Data were recorded in the NHMD as follows:
- 2002–03: 2002 ASGC (Australian Standard Geographical Classification) Statistical Local Area (SLA)
- 2003–04: 2003 ASGC SLA
- 2004–05: 2004 ASGC SLA
- 2005–06: 2005 ASGC SLA
- 2006–07: 2006 ASGC SLA
- 2007–08: 2007 ASGC SLA
- 2008–09: 2008 ASGC SLA
- 2009–10: 2009 ASGC SLA
- 2010–11: 2010 ASGC SLA
- 2011–12: 2011 ASGC SLA
- 2012–13 to 2016–17: 2011 ASGS SA2
- 2017–18 to 2021–22: 2016 ASGS SA2
For the current project, all records were mapped to the SA2s under the ASGS 2016 structure using concordance files, and the SA4 of usual residence derived from the SA2 data. Data recorded in ASGC for the relevant years was mapped to 2011 ASGS SA2 and then to 2016 ASGS SA2 via concordance files. The 2016 ASGS SA2 records were then mapped to 2016 ASGS SA4 using a concordance file.
Reporting of results
In line with AIHW policy on reporting to manage confidentiality, as well as data management protocols for this data set, some data have been suppressed. In particular, where counts for a diagnosis group in a given week in a given jurisdiction or SA4 were less than 5, data were suppressed. Secondary suppression was also applied throughout in the event that a suppressed cell could be identified from a higher-level aggregation.
Data considerations and limitations
Divergence from reporting data
The data presented here on hospitalisations differ from data presented elsewhere (for example, used for reporting purposes) for multiple reasons. Specifications of note include:
- Temporal structure: these data are structured by admission date rather than separation date.
- Geolocation: these data are geolocated according to the patient’s usual place of residence, rather than the hospital location.
- Condition specifications, for example:
- For diabetes mellitus, these data only include records with a relevant principal diagnosis (rather than additional diagnoses). This will underestimate reported diabetes hospitalisations as the majority are recorded as additional diagnoses.
- For mental health, these data only include records with a relevant principal diagnosis (they do not include other records with episodes of specialised psychiatric care).
- The ‘selected heart conditions’ grouping comprises heart conditions including hypertensive disease, coronary heart disease, pulmonary heart disease, and other forms of heart disease. This condition grouping was included in previous AIHW reports on the health impacts of the 2019–20 Australian bushfires.
- Care type scope: These data are focused on acute hospitalisations (and capture only the following care types: acute care, newborn care (excluding newborn care with unqualified days only), mental health care and hospitalisations where the care type was unknown or not reported). Care types that were excluded from the analysis include rehabilitation care, palliative care, geriatric evaluation and management, psychogeriatric care, maintenance care, other admitted patient care, organ procurement – posthumous, and hospital boarder.
Count of hospitalisations
The data reflect a count of hospitalisations as per the source data set, and not the count of unique patients. One hospital stay may result in more than one hospitalisation where a new episode of care is commenced within the same hospital stay.
Annual structure of source data
The NHMD is a compilation of annual data sets, each comprising hospital records with a separation date within a particular financial year. Impacts of methodology and changes to coding standards and practices often occur at the juncture of these financial years.
However, note that the current data set is structured by admission date, rather than separation date.
Specifications of geolocation
The geolocation of the data is based on patients’ usual residence, and not the place of hospitalisation. The patient’s place of usual residence may differ from the location of the patient at the time of condition onset, and any exposure to an environmental influence.
Quality of geolocation data
All the data in this release are presented according to a common geographical structure – 2016 ASGS SA4. However, except in recent years, this is not the structure used to record patients’ area of residence in the underlying source data. To derive this structure, probabilistic population-weighted mapping files have been applied to the source data. For a description of this process and detail of the geographical schemas used in the underlying source data, see Analysis by geography.
This mapping process will tend to reduce the quality of historical geolocation data reported by 2016 ASGS SA4 (relative to more recent periods), and the issue will affect some geographical areas more than others. Where whole historical SLAs, and 2011 ASGS SA2s are mapped to a single 2016 ASGS SA4, the mapping process does not introduce any error. However, there is an issue for areas which are split during the process of mapping forward to the ASGS 2016 SA4. Each juncture which requires a mapping file affects the quality of the geolocation, and this leads to shifts in quality over the time series.
Quality and comparability of diagnosis data
In the admitted patient setting, diagnosis data tend to be high quality; qualified clinical coders record the principal diagnosis as the diagnosis established after study to be chiefly responsible for occasioning the patient’s episode of admitted patient care.
However, practices and policies around recording diagnoses have varied over time, and across jurisdictions. Care has been taken in aligning the data to some extent for the data release; see the Diagnosis groupings section for details on the mapping process and the various coding schemas used in the source data over time (note that in the admitted patient context, the whole relevant history of source data uses ICD-10-AM schemas to classify the diagnosis, which provides a degree of consistency). However, changes in various classifications used to code diagnoses, the associated Australian Coding Standards, and coding practices, are likely to affect the comparability of the hospitalisations and diagnosis data in the data set over time and across jurisdictions.
Of note:
- Changes to the Australian Coding Standard for Rehabilitation (ACS 2104), introduced from 1 July 2015 in the Ninth Edition of ICD-10-AM mean that Category Z50 Care involving the use of rehabilitation interventions (which was previously required to be assigned as the principal diagnosis) has been changed to an ‘Unacceptable principal diagnosis’. The change to the ACS means that the ‘reason’ for rehabilitation will now be identified as the principal diagnosis (rather than as the first additional diagnosis). Therefore, between 2014–15 and 2015–16, the numbers of separations with a principal diagnosis in the ICD-10-AM Chapter 21 Factors influencing health status and contact with health services (Z00–Z99) decreased markedly. Over the same period, there were corresponding increases in principal diagnoses reported for other ICD-10-AM chapters – most notably for Chapter 19 Injury, poisoning and certain other consequences of external causes (S00–T98), and Chapter 13 Diseases of the musculoskeletal system and connective tissue (M00–M99).
- The care type Mental health was introduced on 1 July 2015. The implementation of the mental health care type was incomplete in 2015–16, that is, not all episodes for patients who received mental health care and were admitted before 1 July 2015 and who subsequently separated during 2015–16 were recorded with a mental health care type.
- Following the mental health care type implementation on 1 July 2015, the statistical discharge and readmission of mental health-related patients, resulted in large increases in patient days overall for Queensland (2015–16) and for New South Wales (2016–17). Therefore, information presented by care type from 2015–16 will not be comparable with data presented for earlier periods.
- Changes and clarifications around the Australian Coding Standard for Diabetes mellitus and intermediate hyperglycaemia (ACS 0401) (formerly Diabetes mellitus and impaired glucose regulation) between 2009–10 and 2012–13 affected the comparability over time of data for diabetes. For further information, see: Diabetes: Australian facts, Hospitalisations - Australian Institute of Health and Welfare.
- Clinical guidelines published by Global Initiative for Asthma (GINA) changed in 2019 regarding diagnosis of children with asthma under the age of 6 (see Levy et al. 2022). As a result, a decrease in asthma for children in this age group is observed, with an associated increase in other more general respiratory conditions (such as acute respiratory infection).
State-specific coding rules
The Australian Coding Standards (ACS) are developed for use in both public and private hospitals and are a set of classification guidelines that complement the ICD-10-AM and ACHI Tabular Lists and Alphabetic Indices for certain diseases, health problems and interventions, to promote consistency in the classification of admitted episodes of care. Although all states and territories instruct their coders to follow the ACS, some jurisdictions also apply state-specific coding rules to deal with state-specific reporting requirements. These standards may be in addition to relevant ACS and may affect the comparability of ICD-10-AM/ACHI coded data.
Variation in practices between hospitals
Although there are national standards for data on hospital services, there are some variations in how hospital services are defined and counted, between public and private hospitals, among the states and territories and over time. For example, there is variation in admission practices for some services, such as chemotherapy and endoscopy. As a result, people receiving the same type of service may be counted as same-day admitted patients in some hospitals and as non-admitted patients in other hospitals. In addition, some services are provided by hospitals in some jurisdictions and by non-hospital health services in other jurisdictions. The national data on hospital care does not include care provided by non-hospital providers, such as community health centres. For more information, see Variation in hospital admission policies and practices: Australian hospital statistics.
State-specific data supply changes
There have been various changes in coverage or data supply over time that may affect the interpretation of the data. Some of the more recent examples include the following.
For New South Wales:
- Between 2010–11 and 2011–12, there were substantial increases in counts of Newborn episodes of care with qualified days for New South Wales due to changes in reporting practices.
- From 2015–16, increases in the numbers of separations for private hospitals are, in part, accounted for by improvements in the coverage of reporting.
- Between 2016–17 and 2017–18, changes in admission practices resulted in an apparent decrease in separations for public hospitals. The New South Wales Ministry of Health estimated that about 83,000 separations in 2016–17 would not have been included if the admission practice changes had been implemented in that year.
- Between 2016–17 and 2017–18, changes in the classification of qualified days for Newborn episodes resulted in an apparent decrease in separations for both public and private hospitals. However, the overall number of Newborn separations in 2017–18 was consistent with the overall number in 2016–17.
For Victoria:
- Between 2009–10 and 2010–11 there was a decrease in private hospital separations for Victoria due to the reclassification of some same-day mental health care as non-admitted patient activity (which was previously classified as admitted patient activity).
- From 2009–10, the data for Albury Base Hospital (in New South Wales) have been reported by the Victorian Department of Health and Human Services as part of the Albury Wodonga Health Service. Therefore, the information presented for Victoria will include Albury Base Hospital.
- From 2010–11, some same-day mental health care provided in private hospitals was re-categorised as non-admitted patient activity. These records were thereafter excluded from the NHMD.
- Between 2011–12 and 2012–13, a relatively large decrease in public hospital separations reflected a change in Victoria’s emergency department admission policy.
For Western Australia:
- In 2009–10, Western Australia did not provide data for about 13,000 separations, 2,400 from public hospitals and 10,600 from one private hospital.
- Between 2012–13 and 2013–14, the large decrease in public hospital separations may reflect a change in Western Australia's emergency department admission policy. The Western Australian Department of Health advised that “improved compliance to the Admission Readmission Discharge and Transfer (ARDT) policy led to a reduction in the reporting of invalid admitted activity in the 2013–14 financial year, and hence a decrease in the number of separations and patient days compared with 2012–13.”
For South Australia:
- Between 2015–16 and 2016–17, the numbers of separations decreased due to changes in admission practices for some rehabilitation care at the Repatriation General Hospital. During 2017–18, the Repatriation General Hospital closed, and the Royal Adelaide Hospital was relocated (which affected the numbers of patients admitted).
For Tasmania:
- Some psychiatric care provided in public hospitals was categorised as residential care from 2010–11. In previous years, this activity was categorised as admitted patient care.
For the Australian Capital Territory:
- Prior to 2019–20 data were not available for some private hospitals; in 2019–20 these data were provided for the first time.
References
Levy ML, Bacharier LB, Bateman E, Boulet, L, Brightling, C, Buhl R, Cruz AA, Drazen JM, Duijts L, Fleming L, Hiromasa, I, Ko FWS, Krishnan JA, Mortimer K, Pitrez PM, Sheikh A, Yorgancioglu A and Reddel HK (2023) ‘Key recommendations for primary care from the 2022 Global Initiative for Asthma (GINA) update’. npj Primary Care Respiratory Medicine. 33 (7), doi:10.1038/s41533-023-00330-1.