Australian Burden of Disease conditions
The Burden of Disease conditions list contains 219 conditions in 17 groups. This is not an exhaustive list of all possible health conditions and, as such, the spending associated with ‘other’ conditions within a group is relatively large. For example, spending on Other maternal conditions includes costs related to healthy childbirth, which is not a health condition in the Burden of Disease list. Injury spending can be viewed in two ways, by the nature of injury (such as fractures) and the cause of injury (such as road traffic crashes).
- The condition categories with the highest spending were Other cardiovascular, Other Musculoskeletal, and Dental caries (excludes ‘not elsewhere classified’ groupings).
- The specific conditions with the highest spending were Dental caries, Falls, and Osteoarthritis (excludes all ‘other’ conditions within groups).
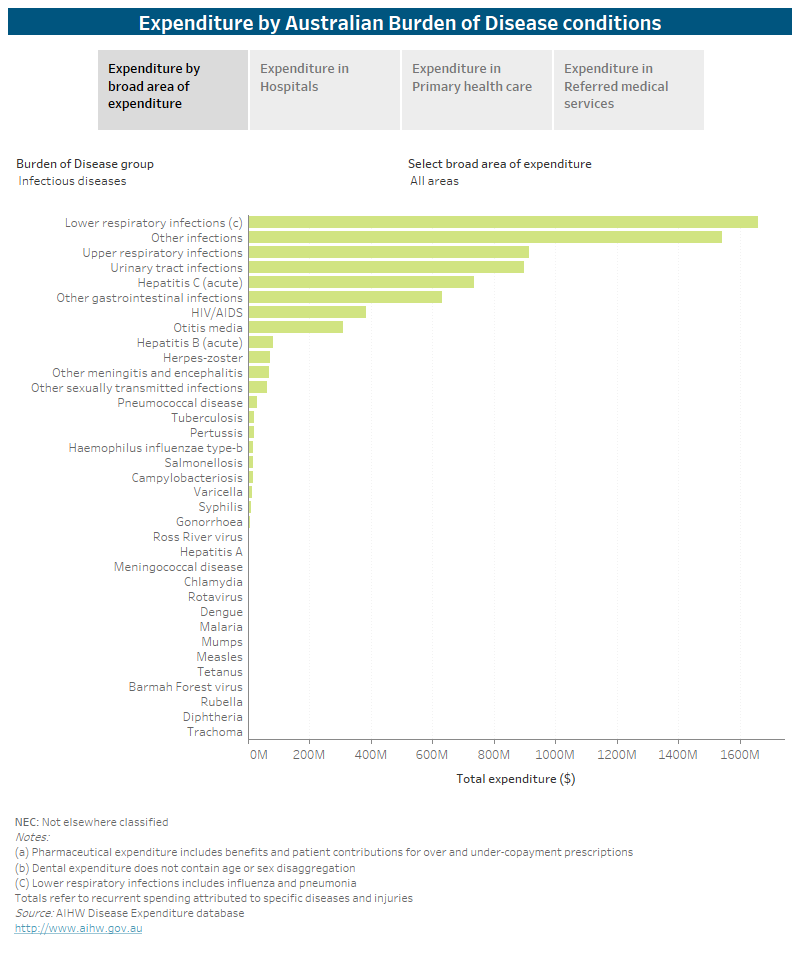
Figure Story D6: Expenditure on disease group by area of expenditure, 2018-19.
This bar chart shows how disease groups and conditions varied by area of spending. By excluding “other” conditions the results are:
- Looking at Hospitals, falls were the leading contributor to expenditure ($3,536 million) followed by osteoarthritis ($3,350 million) and back pain and problems ($2,145 million).
- For Primary health care, dental caries was the disease condition contributing most to expenditure ($4,605 million) followed by depressive disorders ($1,058 million) and type-2 diabetes ($980 million)
- For Referred medical services, back pain and problems had the highest estimated expenditure ($551 million)

Spending on conditions varies by sex.
- For females, spending was highest on Other maternal conditions, Other musculoskeletal conditions and Other cardiovascular diseases. For specific conditions, the highest were Falls, Osteoarthritis, and Back pain and problems.
- For males, spending was highest on Other cardiovascular diseases, Other musculoskeletal conditions, and Other injuries. For specific conditions, the highest were Falls, Osteoarthritis, and Coronary heart disease.
Dental expenditure is not currently able to be reported by age and sex, except when provided through the MBS or as part of a public or private hospital admission. This ranking of conditions for sexes therefore excludes the bulk of dental expenditure.
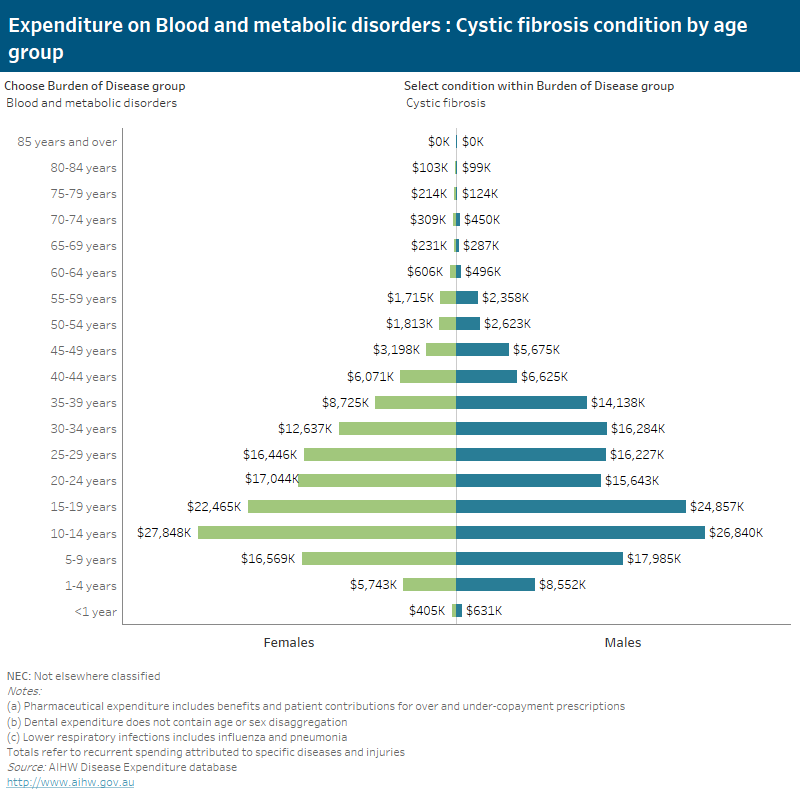
The following interactive data visualisations can be used to display spending on condition groups by age and sex, for each area of expenditure. Data used to create the visualisations can also be downloaded as an Excel workbook.
Figure D7: Expenditure on disease group by condition category, age group, and sex, 2018-19. This butterfly chart shows how disease expenditure was allocated by condition category, age group, and sex in 2018-19. The patterns of disease spending varied significantly by condition category, age group, and sex. For males, spending was the highest on Other cardiovascular diseases ($3,052 million), Other musculoskeletal disorders ($2,442 million), and Other injuries (2,311 million). However, for females, spending was the highest on Other maternal conditions ($4,729 million), Other cardiovascular diseases ($2,977 million) and Other musculoskeletal disorders ($2,967 million).


