Clients, services and outcomes
Financial and housing security challenges faced by older Australians may mean an increase in the number of older people who need help to maintain their housing situation or help with finding stable accommodation. This section explores key issues and characteristics of older Australians seeking support from Specialist Homelessness Services (SHS) from 2013–14 to 2017–18. It focuses on the differences based on the age, sex and state/territory of older people, as well as reasons for seeking assistance, country group of birth, living conditions, service use and additional vulnerabilities of older Australians. The section also considers the various housing situations of older people who received assistance, namely those who at the start of support were:
- experiencing homelessness, living in no shelter/improvised dwelling, short term accommodation, and couch surfer/no tenure, and
- at risk of homelessness, living in public/community housing, private/other housing, and an institutional setting.
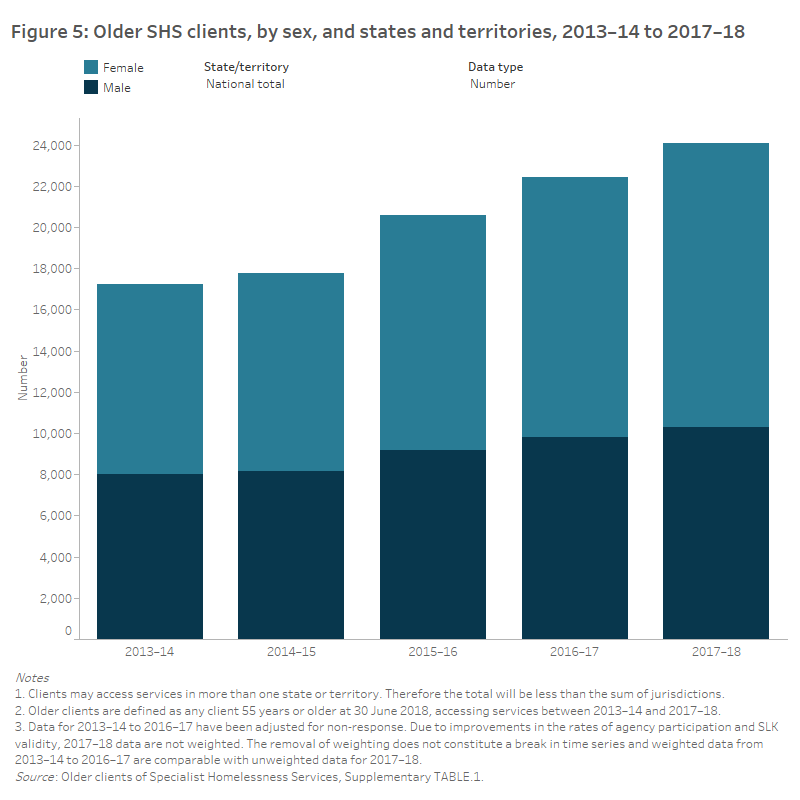
In 2017–18, around 24,100 people aged 55 and over received assistance from SHS agencies, equating to around 36 older clients per 10,000 persons in Australia (aged 55 and over) (Figure 5). This was an increase from around 17,300 SHS clients in 2013–14, or 29 per 10,000 population.
Of the older SHS clients in 2017–18, more were female (13,800) than male (10,300). The proportion of older SHS clients who were female increased from 54% in 2013–14 to 57% in 2017–18 (Supplementary table 1).

In 2017–18, most of the 24,100 older clients were aged 55–64 (15,600 clients or 65%); almost 6,000 (25%) were aged 65–74 and the remaining 2,500 (10%) were aged 75 and over. From 2013–14 to 2017–18, there has been a change in the age profile, with the proportion of those aged 75 and over increasing from 8% to 11%, while the proportion aged 55–64 has decreased from 67% to 65% (Supplementary table 2).
Half (50% or 12,000) of older clients accessed SHS agencies in Victoria. From 2013–14 to 2017–18, Victoria consistently recorded the highest number of older SHS clients and this number has increased at an average annual rate of 8%. New South Wales (5,300 clients), with the second highest number of older clients in 2017–18, had a higher average annual growth , increasing by 16% over the period from 2013–14. Western Australia had the second highest average annual growth, at 13% from 2013–14 to 2017–18 (Supplementary table 1). Note: clients may access services in more than one state or territory. Therefore, the national total will be less than the sum of the states and territories.


