Measures of economic wellbeing
Main source of income
The financial wellbeing of older people when they seek assistance from an SHS agency can be explored using information about the main source of income at presentation. The following analysis is based on 19,500 older SHS clients with valid income source information, excluding 4,600 clients whose income source was not stated.
In 2017–18, the majority (90% or 17,500 clients) of older SHS clients received a type of government payment as their main source of income. Very few older SHS clients reported earning income from employment (5% or 900) as their main source of income or having no income (3% or under 600).
For older SHS clients, the most common government payments reported as a main source of income were Disability Support Pension (6,400 or 33% of the 19,500 older clients) followed by Age Pension (5,200 or 27%) and Newstart Allowance (4,400 or 23%) in 2017–18. Of the older clients aged 55–64, 33% reported Newstart allowance as their main source of income. The vast majority of those reporting Newstart Allowance as their main source of income were aged 55–64 (95%).
Of the 19,500 older SHS clients with income information, more females (9,000 clients or 46%) received government payments as their main source of income than males (8,500 or 43%). Disability Support Pension was the most common government payment type recorded as the main source of income.
Change over time
From 2013–14 to 2017–18:
- The proportion of older clients receiving a government payment as their main source of income at presentation to a SHS agency remained stable at 90% from 2013–14 to 2017–18.
- More male (6,100) than female clients (5,900) received a type of government payment as their main source of income in 2013–14. This changed in 2015–16, when more female (7,700) than male clients (7,600) received a type of government pension and this trend has continued to 2017–18.
- The largest increase was the number of older people reporting Newstart Allowance as their main source of income; increasing by a total of 2,100 clients (up from 2,300 clients in 2013–14 to 4,400 in 2017–18).
- The proportion of older clients receiving Disability Support Pension as their main source of income has declined over time, from 35% to 33%. This was largely driven by a declining proportion of male SHS clients receiving this pension (19% to 17%).
Labour force participation
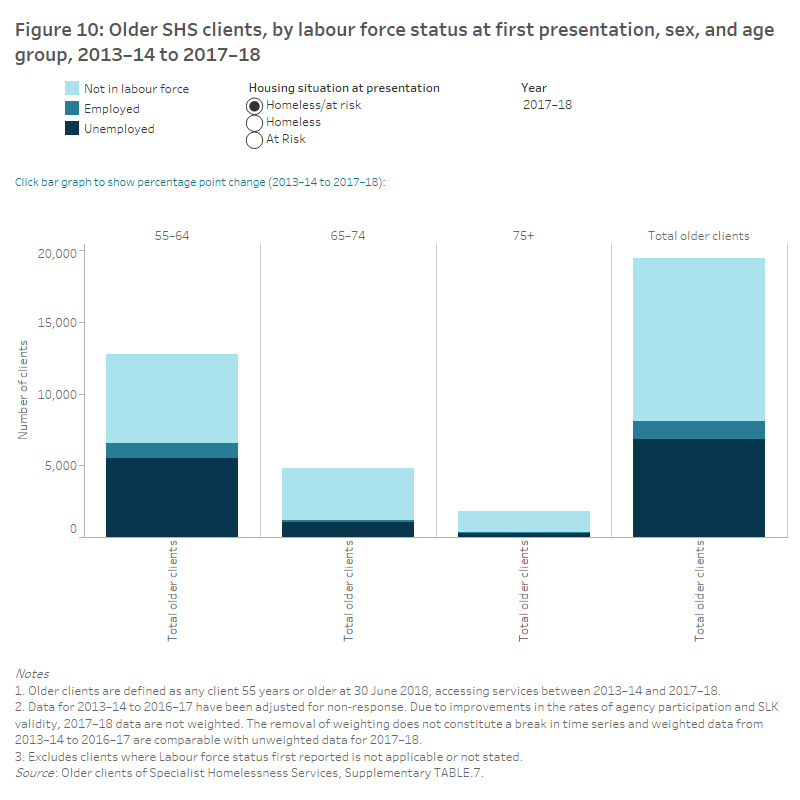
Labour market conditions and unemployment have been linked with homelessness and the risk of homelessness (Johnson et al. 2016). In 2017–18, of the 20,800 older homeless and at risk SHS clients there were 19,500 with a known labour force status at the beginning of support. Over half (11,400 clients or 59%) of these older clients were not in the labour force with a further 6,800 clients (35%) unemployed and 1,200 (6%) employed (Figure 10). Note: this excludes clients whose labour force participation was not stated.
Females were more likely to be employed than males (8% compared with 5%). In contrast, males were more likely to be unemployed (39% compared with 31% for females).
Housing situation
There were differences in the labour force status of older SHS clients presenting to agencies as homeless compared with those at risk of homelessness. In 2017–18:
- Of those older clients who were homeless, 55% were not in the labour force, 41% were unemployed and 4% were employed.
- Of those who were at risk of homelessness, 61% were not in the labour force, 32% were unemployed and 8% were employed.
- Of clients experiencing homelessness, more male clients (45%) were unemployed compared with female clients (36%); more female clients (60%) were not in the labour force compared with male clients (52%) (Supplementary table 7).
Age profile
Across all older age groups, there were more SHS clients not in the labour force, followed by unemployed then employed. In 2017–18, clients aged 55–64 (6,200 clients) were most likely not in the labour force, followed by 5,500 clients who were unemployed and 1,100 employed.
In 2017–18, homeless male clients were most commonly not in the labour force (2,100 clients or 52%). For homeless females, clients not in the labour force were also the most common (1,600 or 60%), again with most aged 55–64 (1,000 or 37%).
Change over time
From 2013–14 to 2017–18:
- The proportion of older homeless or at risk SHS clients presenting who were not in the labour force decreased from 67% to 59%, meaning that in 2017–18, a greater proportion of older clients were working or looking for work.
- There was a 9 percentage point increase in the proportion of clients who presented as unemployed (from 27% to 35%). This trend can be seen in particular, for at risk clients aged 55–64 who were unemployed (increased from 18% to 24% of clients at risk).

References
AIHW 2019a. Specialist Homelessness Services Annual report 2017–18. Cat. no. HOU 299. Canberra: AIHW.
AIHW 2019b. Specialist Homelessness Services Collection manual—July 2019. Cat. no. HOU 313. Canberra: AIHW.
Johnson G, Wood G, Scutella R and Tseng Y 2016. Better understanding entries and exits from homelessness. Australian Housing and Urban Research Institute (AHURI) Research & policy bulletin issue no. 208. Melbourne: AHURI.


