Client characteristics
Indigenous clients
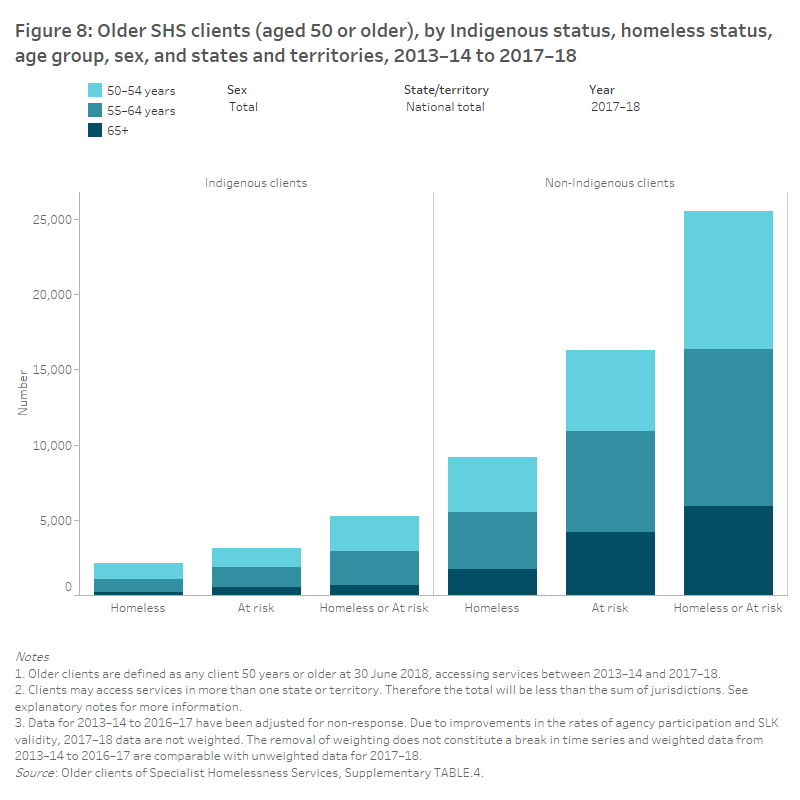
Aboriginal and Torres Strait Islander people are over-represented among SHS clients, including at older ages (AIHW 2019a). Older Indigenous clients are considered to be those aged 50 and over. Almost one-fifth of SHS clients aged 50 and over identified as being Indigenous (17% or 5,300 older clients) (Figure 8). Note: This section differs to elsewhere as the age range is 50 and over. Also, the percent calculations presented throughout this section are limited to those with known homelessness status and Indigenous status. For information about the complex and varied needs of older Indigenous people, see Aboriginal and Torres Strait Islander people aged 50 and over 2019.
Housing situation
In 2017–18, at the beginning of support older SHS Indigenous clients (aged 50 and over) were more likely to be at risk of homelessness (3,100 clients or 59%) than homeless (2,200 clients or 41%). Non-Indigenous clients had a similar distribution (16,300 or 64% and 9,200 or 36% respectively). Of the 5,300 Indigenous older SHS clients, there were more females (2,100 clients) at risk of homelessness at the start of SHS support than males (1,000). There were similar numbers of male (1,100 clients) and female (1,100) older Indigenous SHS clients who presented experiencing homelessness (Supplementary table 4).
Age profile
In 2017–18, the majority of older Indigenous SHS clients (50 and over) were aged 50–64 years (87% or 4,600 clients); 45% aged 50–54 and 42% aged 55–64 years. A further 13% were aged 65 and older. There were similar age profiles for male and female Indigenous clients.
There were different age profiles for Indigenous clients presenting as experiencing homelessness compared with at risk of homelessness. Of the homeless older SHS Indigenous clients, more were in the younger age group (51% aged 50–54 years), higher than the proportion at risk (41% aged 50–54 years).
Change over time
From 2013–14 to 2017–18 (Figure 8):
- The number of older Indigenous SHS clients increased from 2,900 (14% of all older clients) in 2013–14 to 5,300 (17%) in 2017–18. Almost half (44%) of this increase was for clients aged 50–54.
- The number of Indigenous clients presenting to a SHS agency experiencing homelessness almost doubled, from 1,100 clients to around 2,200.
- The largest increase in the number of Indigenous clients was females aged 50–54 at risk of homelessness; increasing from around 480 clients in 2013–14 to around 840 in 2017–18 (Supplementary table 4).

Country group of birth
In 2017–18, of the 20,800 homeless or at risk older SHS clients, details about the country group of birth were known for 18,600 clients (2,300 not stated). Around 7 in 10 of these clients were born in Australia (71% or 13,300 clients), with the remaining 3 in 10 (29%) clients born overseas. For those born overseas, the most common country group of birth was Southern and Eastern Europe (almost 1,000 or 5%) followed by North Africa and the Middle East (800 or 4%).
Two new questions were introduced into the SHS collection, commencing 1 July 2019, to improve the identification of culturally and linguistically diverse clients. Main language other than English spoken at home identifies whether the client speaks a language other than English at home. Proficiency in spoken English is only asked of clients who speak a language other than English at home and indicates how well they speak English. This information is expected to provide evidence that supports research into service access for those who are culturally and linguistically diverse (AIHW 2019b).
Housing situation
In 2017–18, more clients born overseas were at risk of homelessness (3,500 clients) than homeless (1,800) on first presentation.
- Of the overseas born clients at risk of homelessness, most were female (2,000 compared with 1,500 males).
- Of the overseas born homeless clients, most were male (1,000 compared with almost 800 females) (Supplementary table 5).
Change over time
From 2013–14 to 2017–18:
- The largest increase in older clients born overseas were those born in North Africa and the Middle East; increasing by around 400 clients to just over 800 clients (1.1% percentage point increase).
Living arrangements
The majority of older SHS clients who presented to agencies alone (12,100 or 59%) in 2017–18. This has consistently been the case over the five years from 2013–14 (ranging from 59% to 60%). The next most common living arrangements were other family (2,400 or 12%) and couple without child/ren (2,300 or 11%). Other family includes groups with related individuals, including siblings and families of more than two generations (not including lone person, one parent with child(ren), couple with child(ren) and couple without child(ren)). (Note: these data are based on older clients where homelessness status was known and excludes clients whose living arrangement was not stated.)
Housing situation
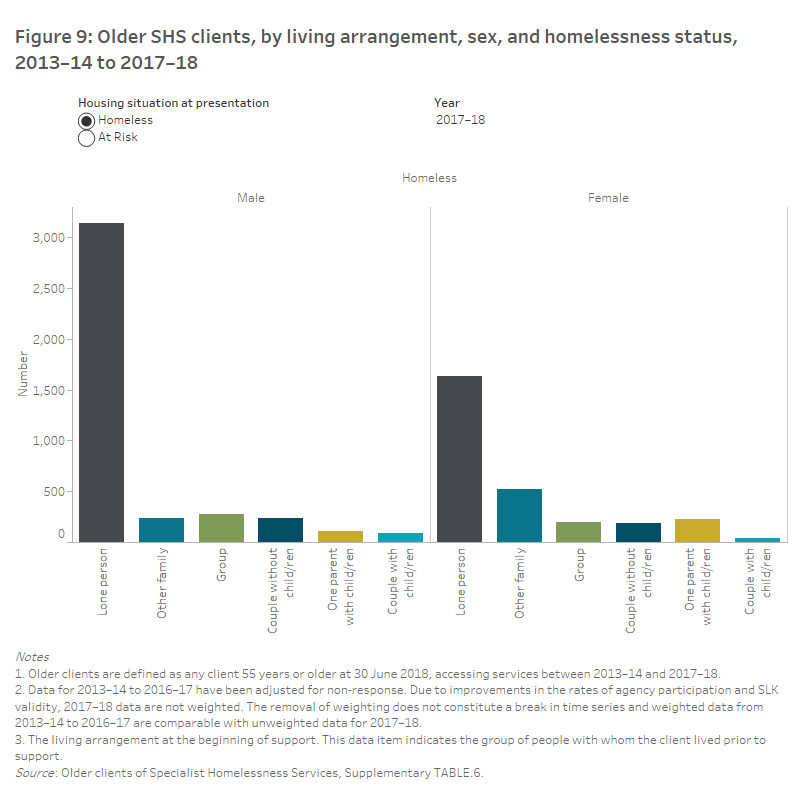
There were differences in the living arrangements of older clients presenting to SHS agencies as either homeless or at risk, and for male and female clients. In 2017–18 (Figure 9):
- A greater proportion of homeless older clients presented alone (69% or 4,800) compared with the proportion of at risk clients (54% or 7,400).
- Homeless male clients (3,100 or 77%) were more likely to present living alone than females (1,600 or 58%).
- Female clients were more likely than male clients to present living with other family members.
- For homeless older clients, around 1 in 5 females lived with other family members (520 or 19%) compared with 1 in 20 males (240 or 6%).
- For those at risk, there were also more female clients (1,200 or 15%) than male clients living with other family members (430 or 8%).
From 2013–14 to 2017–18, there was an increase in older females presenting to SHS agencies homeless who were living with other family members; increasing by almost 3 percentage points, from 16% to 19% of homeless females (from 270 clients to over 500 clients).


