Clients, services and outcomes

Key findings and insights

In 2024–25:

  • Almost 289,000 clients were assisted by specialist homelessness agencies, up from 236,000 clients in 2011–12 – an average annual increase of 1.6%, but similar to 2019–20 (290,000).
  • Clients who had experienced family and domestic violence were the largest cohort of SHS clients, accounting for over 40% of all SHS clients.
  • More than two-fifths of clients continued receiving support in 2024–25, having also received support in 2023–24.
  • For clients who ended support in 2024–25, fewer were experiencing homelessness than at the start of their support.

Specialist homelessness agencies provide a range of services to support people experiencing homelessness, or at risk of, homelessness, from general assistance and to immediate crisis accommodation. The characteristics of all clients assisted by specialist homelessness services (SHS) in 2024–25 are described below, including their needs for assistance and the services they received. 

It is important to note that the number of clients supported by SHS agencies reflects agency engagement and does not necessarily represent the underlying prevalence of homelessness or people at risk of homelessness in Australia.

Characteristics of clients

Figure CLIENTS.1: Characteristics of SHS clients, 2024–25

Dashboard shows the number of SHS clients, by sex, by states and territories, by homeless status, by vulnerabilities, by Indigenous status, and by living arrangements.

Dashboard shows the number of SHS clients, by sex, by states and territories, by homeless status, by vulnerabilities, by Indigenous status, and by living arrangements.

Age and sex

In 2024–25 (Supplementary table CLIENTS.1):

  • The majority of SHS clients were female (60% or 174,000 clients).
  • More than a third of clients were aged 25–44 (36% or 104,000).
  • 3 in 10 clients were aged under 18 (27% or 78,800).
  • The overall rate of SHS clients was higher for females: 1 in 79 females in the Australian population received support compared with 1 in 117 males. 
  • The highest rate of clients among all age groups were those aged 15–17 years: higher for females (193.6 per 10,000 population) than for males (128.8 per 10,000 population).

Indigenous status

In 2024–25, Aboriginal and Torres Strait Islander (First Nations) people were over-represented among SHS clients. Of those clients who provided information on their Indigenous status (Supplementary table INDIGENOUS.2):

  • Around 1 in 3 (29% or almost 82,900 clients) identified as being of Aboriginal and/or Torres Strait Islander origin.
  • This equated to 784.2 First Nations clients per 10,000 Indigenous population compared with 81.9 for non-Indigenous clients.

For further information please see First Nations clients.

State and territory

Noting that clients may have accessed services in more than one state or territory throughout the year (Supplementary table CLIENTS.1):

  • The largest number of clients received services in Victoria (105,000), followed by New South Wales (67,800) and Queensland (54,700).
  • The highest rate of SHS clients was in the Northern Territory (401.9 clients per 10,000 population), followed by Victoria (151.2) and Tasmania (110.0).
  • Females had higher rates of service use than males across all states and territories; the Northern Territory had the most pronounced difference between females (557.9 per 10,000 females) and males (254.1 per 10,000 males).

Main source of income

Income support was common among SHS clients aged 15 and over. At the start of support in 2024–25 (Supplementary table CLIENTS.16):

  • Four-fifths (78%) of clients received some form of government payment (including awaiting a government payment) as their main source of income.
  • Around 1 in 10 (11%) clients reported employment as their main source of income.
  • Fewer than 1 in 10 (9.4%) clients reported having no income.

The most common government payments were JobSeeker (28% or 56,400 clients), Parenting Payment (18% or 35,800) and Disability Support Pension (15% or 31,200).

Of clients aged 15 and over who needed assistance to obtain or maintain a government allowance or employment support:

  • the proportion with no income declined from 12% at the start of support to 7.2% at the end; 
  • the proportion waiting for government benefits almost halved, from 4.5% to 2.4% (Supplementary table CLIENTS.35).

Labour force and Education enrolment status

Of clients aged 15 or over whose labour force status was known at the start of support in 2024–25 (Supplementary tables CLIENTS.19):

  • Almost one-fifth (16% or 32,700) were employed, with the majority (19,500) in part-time work.
  • More than half (53% or 109,000) were unemployed; males (57%) were more likely to be unemployed than females (50%).
  • Nearly one-third (31% or 64,300) were not in the labour force.

Employment increased following support. Among clients who needed employment assistance, 18% were employed at the start of support, rising to 25% at the end of the support (Supplementary table CLIENTS.34).

For clients aged 5–24 whose educational status was known in 2024–25 (Supplementary table CLIENTS.18):

  • Around half (54% or 45,600) were enrolled in some form of education.
  • Around 9 in 10 (89% or 31,000) clients aged 5–14 were enrolled in school or other education.
  • Approximately 7 in 10 (70% or 34,400) clients aged 15–24 were not engaged in any form of education.

Living arrangements

The most common living arrangement reported by SHS clients at the start of support was lone persons (34% or 95,600 clients), followed by lone parents with one or more children (34% or 95,500 clients), and other family groups (12% or 33,200) (Supplementary table CLIENTS.10). 

  • 41% of female clients were single parents, compared with 25% of males.
  • 45% of male clients lived alone, compared with 27% of females.

Clients’ reasons for assistance

One in four SHS clients (27%) cited family and domestic violence as their main reason for seeking support in 2024–25. 

The SHSC includes information about clients’ needs for services from two perspectives:

  • Client-reported reasons for seeking assistance – both their main reason and all reasons for seeking support are collected at the start of support.
  • Agency worker assessment of client needs – recorded when clients first present and updated monthly while the client remains in contact with the agency.

Further details on how clients’ needs are captured are in the Technical notes and Glossary. Additional information is available in the chapter Services provided and unmet need

In 2024–25, SHS clients most commonly sought assistance for the following reasons (Supplementary table CLIENTS.21):

  • accommodation issues – including housing crisis (for example, eviction), inadequate or inappropriate dwelling conditions, or the end of previous accommodation (56% or 160,000 clients)
  • financial difficulties (41%, 118,000)
  • family and domestic violence (38%, 109,000)
  • housing affordability stress (36%, 104,000).

The most common main reasons for seeking assistance in 2024–25 were (Figure CLIENTS.2, Supplementary table CLIENTS.22):

Figure CLIENTS.2: Main reason for seeking assistance (top 6), by homelessness status, 2024–25

Stacked bar chart shows the most common main reasons for seeking assistance are Family and domestic violence (76,456) and Housing crisis  52,757).

Stacked bar chart shows the most common main reasons for seeking assistance are Family and domestic violence (76,456) and Housing crisis  52,757).

Among clients experiencing homelessness when they first started receiving support in 2024–25, the most common main reasons were (Supplementary table CLIENTS.23):

  • housing crisis (22% of homeless clients)
  • inadequate or inappropriate dwelling conditions (19%)
  • family and domestic violence (18%).

For clients at risk of homelessness, the most common main reasons were: 

  • family and domestic violence (31% of clients at risk of homelessness)
  • housing crisis (17%)
  • financial difficulties (14%).

Patterns of service use in 2024–25

More than three-fifths (63% or 183,000) of SHS clients either continued to access support in 2024–25 after having received it in 2023–24 or returned to SHS support after a period without assistance.

Flow of clients into and out of SHS support

Clients can follow varied pathways into and out of SHS support. Some have never previously received SHS support, others return after a period without support, and some require consecutive periods of support each year. 

In 2024–25 (Figure CLIENTS.3, Supplementary tables CLIENTS.2 and CLIENTS.40):

  • Over one-third (37% or 106,000 clients) had not previously received SHS support since the collection began in July 2011.
  • More than two-fifths (42% or 122,000 clients) continued receiving support after also receiving support in 2023–24.
  • One in 5 (21% or 60,900 clients) returned to SHS support after not receiving it in the previous 12 months.
  • Almost three-quarters (73% or 211,000 clients) ended their support in 2024–25.

Figure CLIENTS.3: Clients by service user group, 2024–25

Bar chart shows the most common groups are Exiting clients with closed support (210,841), Continuing clients (112,184), and New clients (105,921).

Bar chart shows the most common groups are Exiting clients with closed support (210,841), Continuing clients (112,184), and New clients (105,921).

First time clients

In 2024–25, there were 106,000 first-time SHS clients (that is, clients who had not received SHS support at any time since July 2011) (Supplementary tables CLIENTS.2 and CLIENTS.39).

Clients experiencing homelessness

Around half (47% or 46,300) were experiencing homelessness at the start of their first support period. The top 3 main reasons for needing assistance among these clients were: 

  • family and domestic violence (21% or 9,800 new clients experiencing homelessness) 
  • housing crisis (21%, or 9,500)
  • inadequate or inappropriate dwelling conditions (18% or 8,200).

Clients at risk of homelessness

The top 3 main reasons for assistance among new clients at risk of homelessness were: 

  • family and domestic violence (36% or 18,600 new clients at risk of homelessness)
  • housing crisis (16% or 8,400)
  • financial difficulties (13% or 6,800 clients).

Length of support

Data collected by specialist homelessness agencies also describes support periods. A support period is the length of time a person at risk of, or experiencing, homelessness receives support services – from the beginning to the end of support (see Technical notes for further information). 

Clients may have had more than one support period in 2024–25, either with the same agency at different times or with different agencies. The duration of each period can vary depending on the complexity of clients’ needs. 

In 2024–25:

  • SHS clients had around 492,000 support periods, an average annual increase of 1.8% since 2011–12 (Historical table HIST.CLIENTS).
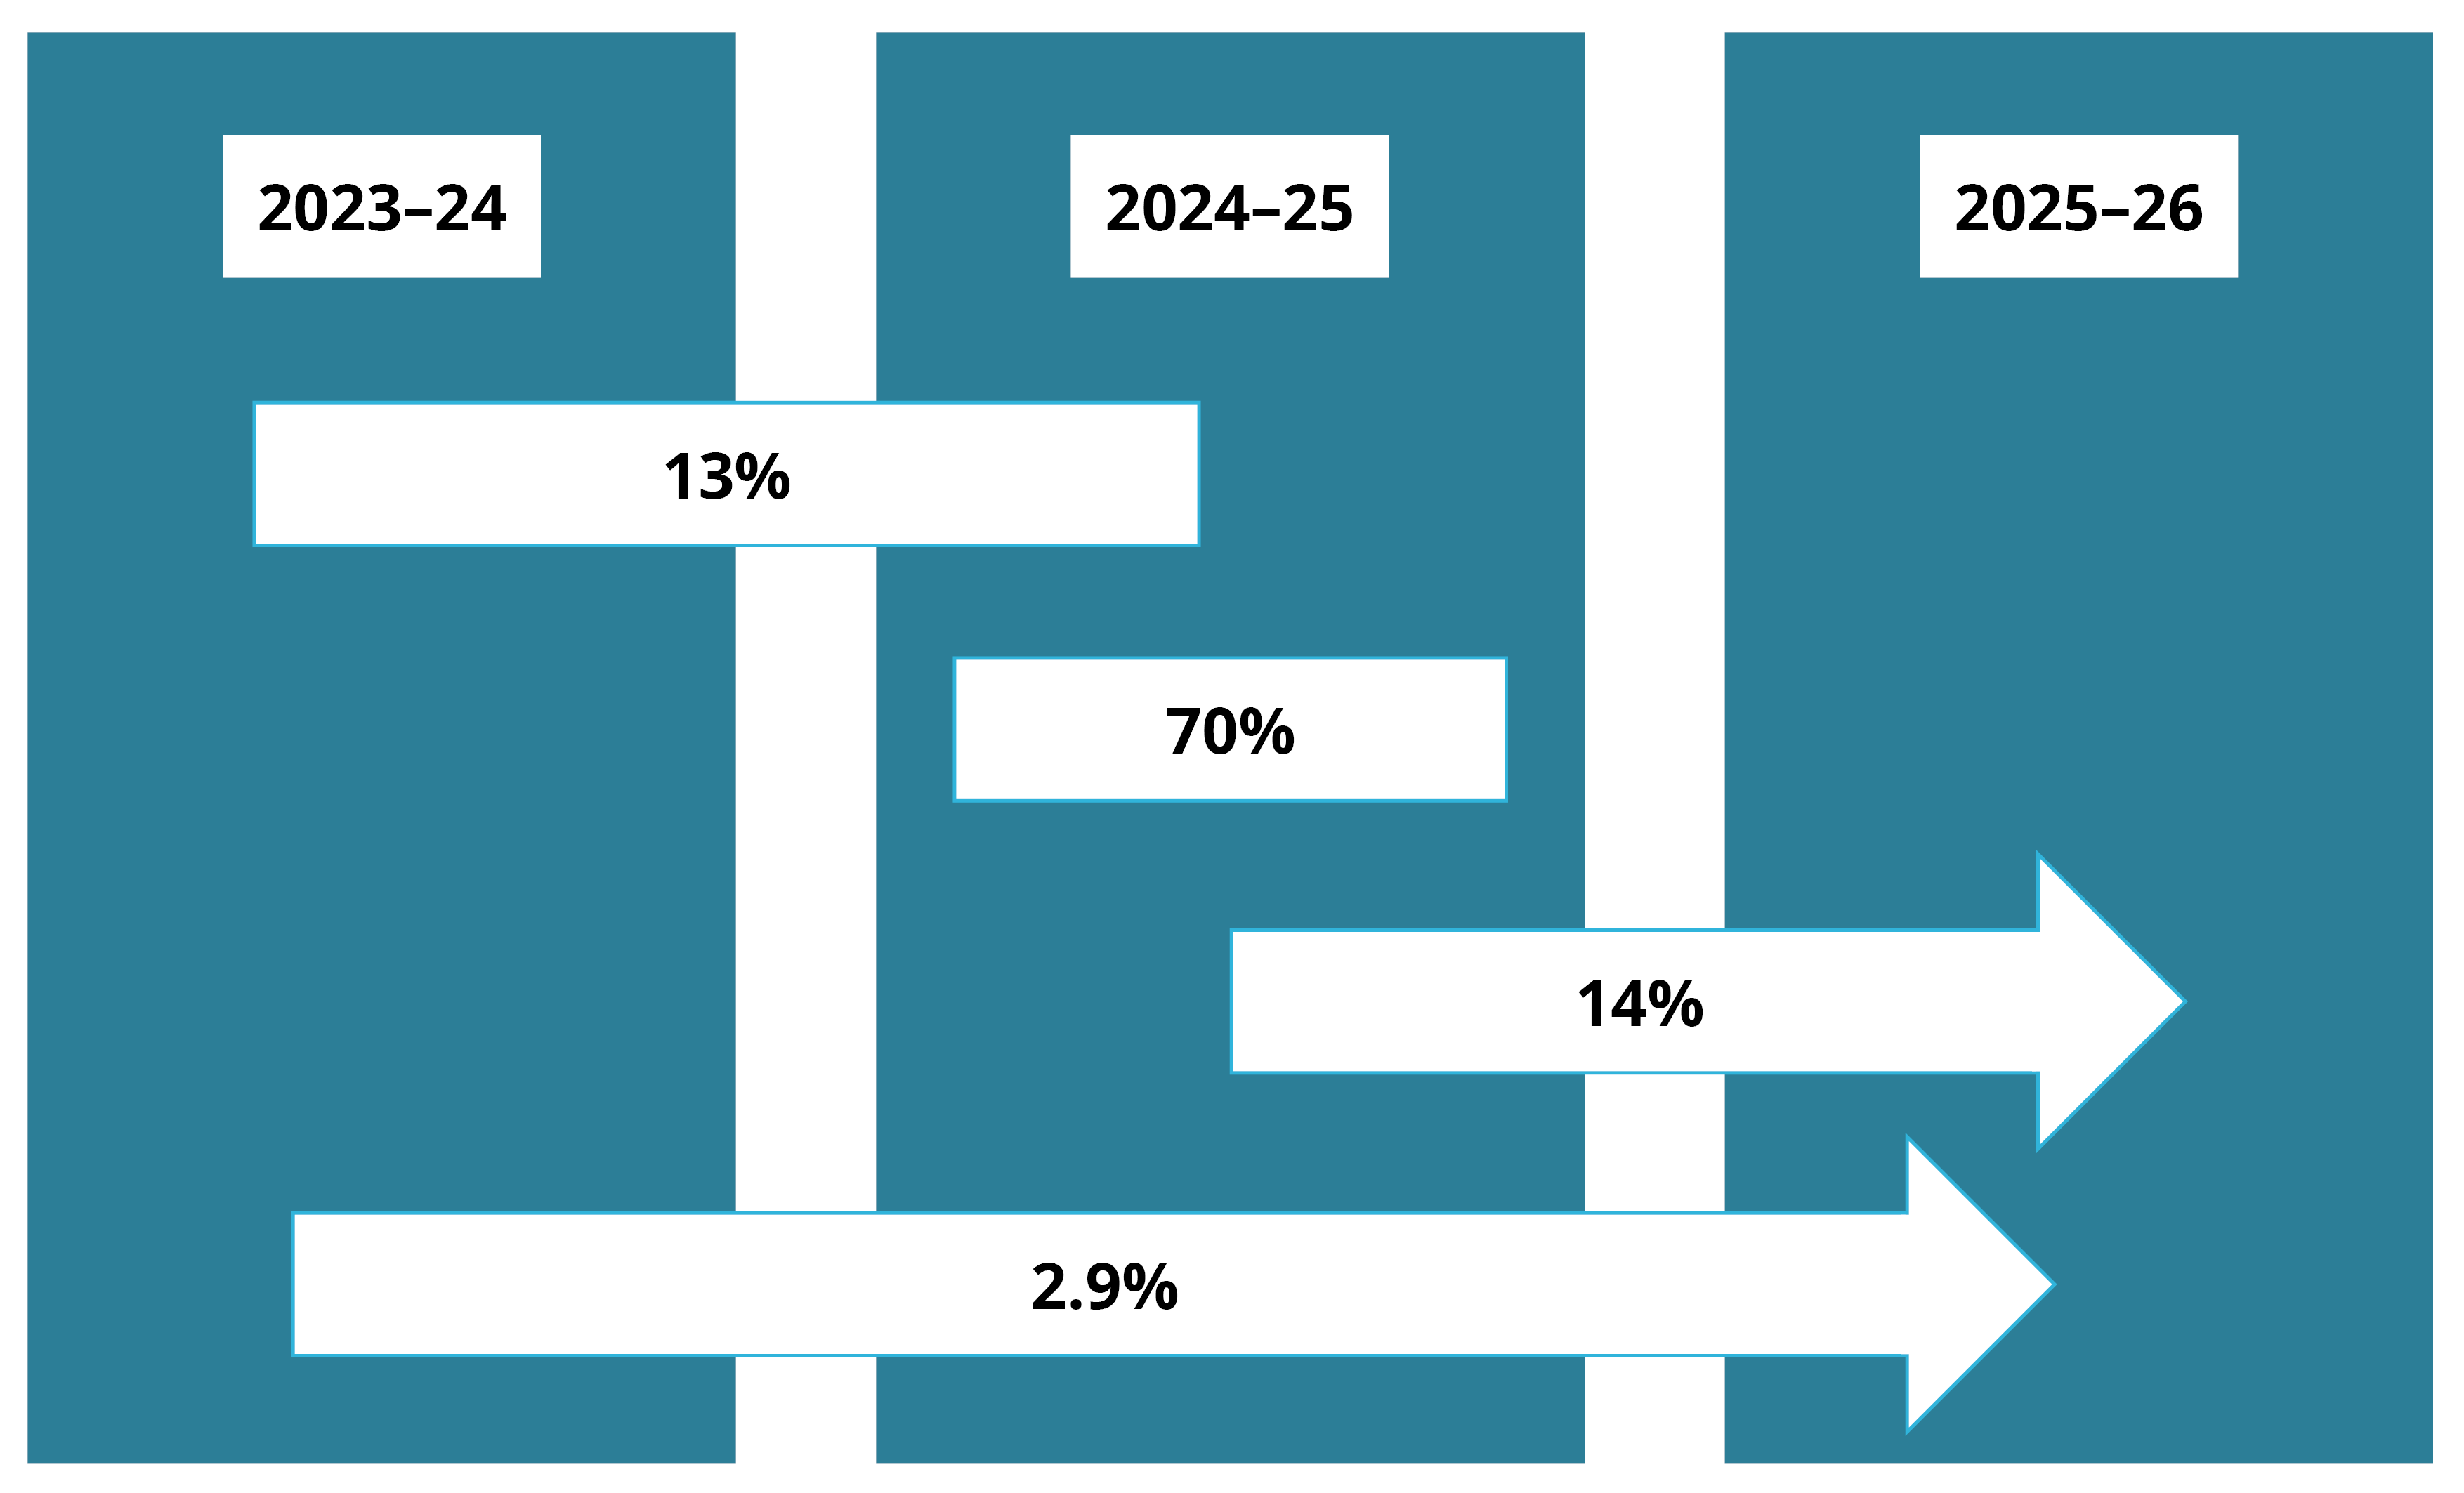
  • Most support periods (70% or around 344,000) both opened and closed within the financial year. An additional 14% opened during the year and were still open on 30 June 2024, while a small proportion (2.9%) were ongoing for the full reporting period (Figure CLIENTS.4, Supplementary table CLIENTS.28).
  • Two-thirds (66%) of clients had only one support period, 19% had 2 support periods, 7.4% had 3 support periods and 7.2% had 4 or more (Supplementary table CLIENTS.27).
  • The median number of support days for clients was 58 days; females had more support days (61 days) than males (54 days) (Supplementary table CLIENTS.29).
  • The median number of nights accommodated increased to 34 nights, compared with 33 nights in 2023–24 and 31 nights in 2022–23 (Supplementary table CLIENTS.48).

Figure CLIENTS.4: Support periods, by indicative duration over the reporting period, 2024–25

Image shows collection periods from 2023–24 to 2025–26. Most support periods (70%) began and ended in 2024–25 and 14% remained opened.

Source: Specialist Homelessness Services Collection 2024–25, Supplementary table CLIENTS.28.

The needs of some clients can be met relatively quickly, while clients with more complex needs receive longer periods of support. This is reflected in the distribution of support period durations: 

  • Up to 5 days: 16% (47,400 clients)
  • 6–45 days:   28% (79,900 clients)
  • 46–90 days: 17% (49,400 clients)
  • 91–180 days:    18% (52,600 clients)
  • Over 180 days: 20% (59,600 clients) (Supplementary table CLIENTS.29).

Reasons support ended

In 2024–25, support periods ended for a variety of reasons. More than half (59%) concluded because the client’s immediate needs were met or their case management goals were achieved (Supplementary table CLIENTS.30).  Other reasons included:

  • No longer requested assistance: One in 5 (20%) ended because clients either decided they did not need support or had moved out of the state, territory or region.
  • Lost contact: 13% of support periods closed because contact with the client was lost.
  • Referred to another agency: 11% of support periods ended due to referral to another specialist homelessness agency. 

Housing situation and outcomes

For SHS clients who ended support in 2024–25, fewer were experiencing homelessness than at the start of their support.

Housing situation at first presentation

Among clients whose housing status was known at the beginning of their first support period in 2024–25 (Figure CLIENTS.5, Supplementary tables CLIENTS.11 and CLIENTS.12):

  • More clients were at risk of homelessness (51% or 139,000), than experiencing homelessness (49% or 133,000).
  • Around 1 in 3 (91,600) clients were living in private or other housing.
  • Over 55,000 clients (31,400 females and 23,700 males) were living in short-term temporary accommodation.
  • A higher proportion of male clients (56%) were experiencing homelessness compared with female clients (44%).

Figure CLIENTS.5: Clients by housing situation at the beginning of support, 2024–25

Bar chart shows for those clients housed, most were in private or other housing when they sought homelessness services.

Bar chart shows for those clients housed, most were in private or other housing when they sought homelessness services.

In recent years, the number of SHS clients sleeping rough at the start of their support has risen from 25,000 clients in 2019–20 to 34,800 in 2024–25. In 2024–25, around half (48%) of clients sleeping rough had no dwelling (sleeping in streets, parks, or open spaces), one-quarter (23%) were in a motor vehicle, and around one in ten were in caravans (10%) or tents (9.2%). Most dwelling type proportions have remained stable since 2019–20, except for tents, which increased from 5.4% (or from 1,300 to 3,300 clients) (Supplementary table CLIENTS.13). Note that the number of SHS clients sleeping rough at the start of support under-estimates the total number of SHS clients sleeping rough throughout the financial year. See Specialist homelessness services: trends in rough sleeping for more detailed analysis of the period 2017–18 to 2022–23. 

Housing outcomes at end of support

Many clients had long or multiple support periods during 2024–25 and may have experienced several changes in their housing situation over the course of their support. 

The outcomes presented here compare clients’ housing situation at the start of their first support period in 2024–25 with their housing situation at the end of their last support period within the same year. 

These data are limited to clients who stopped receiving support during the financial year and were no longer receiving ongoing support from a SHS agency (211,000 clients, or 73% of all SHS clients).

Three aspects of a client’s housing situation are considered in their housing circumstances: dwelling type, housing tenure and the conditions of occupancy. See Data presentation and derivations for details on how each category is derived.

By the end of their support, many clients had achieved or progressed toward more stable housing. In particular, the proportion of clients ending support in public/community housing (renter or rent-free) or private housing (renter or rent-free) increased to 62% compared with 50% at the start of support.

In 2024–25, among clients known to be experiencing homelessness at the start of support (90,400 clients) (Figure CLIENTS.6 and Supplementary table CLIENTS.31):

  • Fewer clients were experiencing homelessness at the end of support (56,400). Most of these clients were either in short-term accommodation (23,200 clients) or couch surfing (18,600 clients).
  • Almost 14,000 clients ended support in private housing and 12,200 ended support in public/community housing.

In 2024–25, among clients known to be at risk of homelessness at the start of support (104,000 clients):

  • Most clients maintained their housing situation by the end of support, with around 59,000 in private housing and 27,800 in public or community housing.
  • The number of clients in public or community housing increased from 27,600 at the start of support to 27,800 at the end. Almost 3,700 of these clients moved from private housing to avoid homelessness.
  • Nearly one in 10 clients (9,100 clients) ended support experiencing homelessness.

Figure CLIENTS.6: Housing situation at beginning and at end of support for clients with closed support, 2024–25

Sankey diagram shows clients’ housing situation from start to end of support. Most clients started and ended support in private or other housing.

Sankey diagram shows clients’ housing situation from start to end of support. Most clients started and ended support in private or other housing.