Children on care and protection orders
On this page
Care and protection orders (CPOs) are legal orders or arrangements that place some responsibility for a child’s welfare with child protection authorities. In Australia, state and territory governments are responsible for child protection and these departments assist vulnerable children and young people to protect them from abuse, neglect or other harm or where their parents are unable to provide adequate care or protection (AIHW 2020).
Between 2014–15 and 2018–19, the rate of children on care and protection orders increased from 9.1 per 1,000 children to 10.5 per 1,000 children (AIHW 2020). Of the 59,100 children on care and protection orders at 30 June 2019, most were living in home-based care, either with relative/kinship carers (39%) or in foster care (29%). While many children are moved into out-of-home care, others remain living at home with family support provided by community-based agencies.
Pathways into homelessness for children on care and protection orders are complex. For example, children and young people who are exposed to persistent violence, abuse and neglect in their family homes but are not removed by child protection authorities may become homeless, as they are no longer prepared to live in these households (Noble-Carr & Trew 2018). Children with unsatisfactory foster care arrangements can either voluntarily move out of their foster home into homelessness or can be placed in residential care settings by child protection authorities.
Family and domestic violence is one of the main reasons that families at risk of homelessness seek assistance from SHS agencies. It is also one of the leading reasons for statutory intervention, indicating that child protection and SHS agencies often work with the same families and children (MICAH Projects 2016). Linked data has been used to describe the characteristics of children and young people who received both child protection (an investigated notification, care and protection order or out-of-home care) and specialist homelessness services (SHS) (AIHW 2016). Compared with children who accessed only SHS, children who accessed both child protection and SHS were more likely to have experienced family and domestic violence (54%, compared with 44%). For more information about children on care and protection orders, see Child protection Australia 2018–19.
Two of the national priority cohorts for homelessness identified in the National Housing and Homelessness Agreement, which came into effect on 1 July 2018 (CFFR 2018), potentially involve children on care and protection orders: children and young people and those exiting institutions and care into homelessness (see Policy section for more information).
Reporting children on care and protection orders in the Specialist Homelessness Services Collection (SHSC)
A client is reported as being under a care and protection order (CPO) if they are aged under 18 and have provided any of the following information in any support period during the reporting period.
They reported that they were under a CPO and had the following care arrangements:
- residential care
- family group home
- relatives/kin/friends who are reimbursed
- foster care
- other home-based care (reimbursed)
- relatives/kin/friends who are not reimbursed
- independent living
- other living arrangements
- parents, or
They have reported ‘transition from foster care/child safety residential placements’ as a reason for seeking assistance or the main reason for seeking assistance.
For more information, see Technical information.
Key findings
- In 2019–20, almost 8,800 children and young people on a CPO received assistance from a specialist homelessness services (SHS) agency, and just over half (51%) were female.
- Around 6 in 10 (59%) of these clients on a CPO were aged 0–9 and males were more likely to be in this age group (63% of male clients, compared with 56% of females).
- Half (50%) had experienced family and domestic violence and 42% had a current mental health issue.
- More than half (57%) of clients on a CPO had received assistance from a SHS agency at some point since the collection began in 2011–12.
- The most common care type arrangements for clients on a CPO were parents (64%) and relative(s) or kin (25%).
- The proportion of children on a CPO who were homeless decreased from 47% to 34% following SHS support, with clients living in public or community housing increasing from 17% at the beginning of support to 26% at the end of support.
- One in 7 (14%) of those with a case management plan achieved all the set goals, lower than young people (aged 15–24) who presented to SHS agencies alone (16%) and lower than that in the overall SHS population (21%).
Client characteristics
In 2019–20 (Table CPO.1):
- SHS agencies assisted almost 8,800 children on a CPO, representing a decrease of nearly 400 clients from 2018–19.
- Children on a CPO made up 3% of the overall SHS population and 10% of all SHS clients aged under 18.
- The rate of children on a CPO receiving assistance from SHS agencies was 3.5 per 10,000 population; a decrease from 3.7 in 2018–19.
|
|
2015–16 |
2016–17 |
2017–18 |
2018–19 |
2019–20 |
|---|---|---|---|---|---|
|
Number of clients |
9,305 |
9,100 |
8,669 |
9,172 |
8,791 |
|
Proportion of all clients |
3 |
3 |
3 |
3 |
3 |
|
Rate (per 10,000 population) |
3.9 |
3.8 |
3.5 |
3.7 |
3.5 |
Notes:
- Rates are crude rates based on the Australian estimated resident population (ERP) at 30 June of the reference year. Minor adjustments in rates may occur between publications reflecting revision of the estimated resident population by the Australian Bureau of Statistics.
- Data for 2015–16 to 2016–17 have been adjusted for non-response. Due to improvements in the rates of agency participation and SLK validity, data from 2017–18 are not weighted. The removal of weighting does not constitute a break in time series and weighted data from 2015–16 to 2016–17 are comparable with unweighted data for 2017–18 onwards. For further information, please refer to the Technical Notes.
Source: Specialist Homelessness Services Collection 2015–16 to 2019–20.
Age and sex
In 2019–20, of clients on a CPO (Supplementary table CPO.1):
- Half were female (51% or over 4,500 clients)
- The majority were aged 0–9 (59% or more than 5,200 clients)
- Male clients on a CPO were more likely to be in the 0–9 age group (63%, compared with 56% females) while female clients were more likely to be in the 15–17 age group (24%, compared with 17% males).
Indigenous status
In 2019–20, 1 in 3 children on a CPO identified as Aboriginal or Torres Strait Islander (36% or almost 3,100 clients) (Supplementary Table CPO.8), higher than the overall SHS Indigenous proportion (27%).
State and territory
In 2019–20 (Supplementary table CPO.2):
- The largest number of clients on a CPO who accessed services was in Victoria (44% or 3,900 clients), followed by New South Wales (27% or 2,400 clients).
- The highest rate of clients on a CPO was in the Northern Territory (13.9 clients per 10,000 population), followed by Victoria (5.9 clients per 10,000).
Presenting unit
- Over 1 in 5 (22%) children presented alone (Supplementary table CPO.9), with proportionally more females (25%) than males (19%).
Living arrangements
- The most commonly reported living arrangement among children on a CPO (Supplementary table CPO.10) was a single parent with one or more children (53% or nearly 4,600 clients), followed by other family (19% or over 1,600 clients).
- Most male and female clients on a CPO usually lived as a part of a family comprising single parent with one or more children (54%, compared with 52% females).
Care arrangement type
- The most common care arrangement among clients on a CPO (Supplementary table CPO.12) was parents (64% or 5,600 clients), followed by relative(s) or kin (25% or almost 2,200 clients).
- Most clients aged 0–9 had parents as their care arrangement (74% or almost 3,900 clients), followed by relative(s) or kin (25% or 1,300 clients).
- Among clients aged 15–17, similar proportions had parents (30% or over 500 clients), independent living (24% or over 400 clients) and other living arrangements (23% or over 400 clients) as care arrangements.
- Clients who received SHS assistance in Remote/Very remote areas were more likely to have family group home as their care arrangement (19%, compared with Major cities 3%, Inner regional 3% and Outer regional 9% areas).
Selected vulnerabilities
Children on a CPO may face additional vulnerabilities that make them more susceptible to becoming homeless, in particular family and domestic violence, a current mental health issue and problematic drug and/or alcohol use. These vulnerabilities are only assessed in clients aged 10 and over.
In 2019–20, of the nearly 3,600 clients on a CPO who were aged 10 and over, 2 in 3 (70%) reported experiencing one or more of these vulnerabilities (Table CPO.2):
- Half (50% or 1,800 clients) had experienced family and domestic violence.
- Over 2 in 5 (42% or 1,500 clients) had a current mental health issue.
- One-quarter (24% or 900 clients) reported only experiencing family and domestic violence while an additional 16% (600 clients) reported both a current mental health issue and family and domestic violence (and no experience of problematic drug and/or alcohol use).
- 8% (nearly 300 clients) reported experiencing all 3 vulnerabilities.
|
Family and domestic violence |
Mental health issue |
Problematic drug and |
Clients |
Per cent |
|---|---|---|---|---|
|
Yes |
Yes |
Yes |
280 |
7.8 |
|
Yes |
Yes |
No |
566 |
15.8 |
|
Yes |
No |
Yes |
70 |
2.0 |
|
No |
Yes |
Yes |
129 |
3.6 |
|
Yes |
No |
No |
876 |
24.4 |
|
No |
Yes |
No |
535 |
14.9 |
|
No |
No |
Yes |
47 |
1.3 |
|
No |
No |
No |
1,081 |
30.2 |
|
|
|
|
3,584 |
100.0 |
Notes
- Clients are assigned to one category only based on their vulnerability profile.
- Clients are aged 10–18.
- Totals may not sum due to rounding.
Source: Specialist Homelessness Services Collection 2019–20.
Housing situation on first presentation
At the beginning of the first support period almost half (47%) of all children on a CPO presented to services experiencing homelessness, with 53% at risk of homelessness (Supplementary table CLIENTS.12).
Service use patterns
- Children on a CPO who received assistance from SHS agencies in 2019–20 had a median of 95 days of support and an average of 1.8 support periods per client (Table CPO.3).
- 1 in 2 (48%) clients on a CPO were provided with accommodation with a median of 66 nights of accommodation.
|
|
2015–16 |
2016–17 |
2017–18 |
2018–19 |
2019–20 |
|---|---|---|---|---|---|
|
Length of support (median number of days) |
87 |
99 |
97 |
95 |
95 |
|
Average number of support periods per client |
1.7 |
1.8 |
1.8 |
1.8 |
1.8 |
|
Proportion receiving accommodation |
54 |
53 |
51 |
49 |
48 |
|
Median number of nights accommodated |
67 |
69 |
66 |
62 |
66 |
Notes:
- The denominator for the proportion receiving accommodation is all children on a care and protection order. Denominator values for proportions are provided in the relevant supplementary table.
- Data for 2015–16 to 2016–17 have been adjusted for non-response. Due to improvements in the rates of agency participation and SLK validity, data from 2017–18 are not weighted. The removal of weighting does not constitute a break in time series and weighted data from 2015–16 to 2016–17 are comparable with unweighted data for 2017–18 onwards. For further information, please refer to the Technical Notes.
Source: Specialist Homelessness Services Collection 2015–16 to 2019–20.
New or returning clients
More than half of the children on a CPO (57% or 5,000 clients) were returning clients (Supplementary table CPO.7), having received assistance from a SHS agency at some point since the collection began in 2011–12. Returning clients were more likely than new clients to be aged 10–17 (43%, compared with 38%), conversely new clients were more likely to be aged 0–9 years (62% compared with 57% of returning clients).
Main reasons for seeking assistance
In 2019–20, the main reasons for seeking assistance among children on a CPO were (Supplementary table CPO.5):
- family and domestic violence (38% or over 3,300 clients)
- housing crisis (18% or 1,600 clients)
- inadequate or inappropriate dwelling conditions (8% or over 700 clients).
Family and domestic violence was the most common reason for seeking assistance for both homeless and at risk children on CPO, though the proportion was much higher for children at risk (46% or nearly 1,900 clients, compared with 28% or nearly 1,100) (Supplementary table CPO.6).
Services needed and provided
Similar to the overall SHS population, most children on a CPO needed general services that were provided by SHS agencies including advice/information, advocacy/liaison on behalf of client and other basic assistance (Supplementary table CPO.3).
Apart from these, the most common services needed by children on a CPO were:
- short-term or emergency accommodation (44% or nearly 3,900 clients), with 76% of those needing this service also receiving this service
- assistance for family/domestic violence (44% or more than 3,800 clients), with 92% receiving this service
- material aid/brokerage (43% or almost 3,800 clients), with 86% receiving this service
- long-term housing (37% or over 3,200 clients), with 4% receiving this service.
Children on a CPO were also more likely than the overall SHS population to need services including:
- family/relationship assistance (30%, compared with 16%), with 85% receiving this service
- transport services (30%, compared with 18%), with 92% receiving this service
- child protection services (28%, compared with 5%), with 76% receiving this service
- living skills/personal development (27%, compared with 19%), with 92% receiving this service
- assistance for trauma (23%, compared with 13%), with 81% receiving this service.
- assistance with challenging social/behavioural problems (22%, compared with 12%), with 86% receiving this service
The majority (85%) of children on a CPO had a case management plan. However, only 14% of those with a case management plan achieved all the set goals. The proportion of children on a CPO who achieved all case management goals was lower than that in the overall SHS population (21%) (Supplementary table CLIENTS.35).
Outcomes at the end of support
Outcomes presented here describe the change in clients’ housing situation between the start and end of support. Data is limited to clients who ceased receiving support during the financial year—meaning that their support periods had closed and they did not have ongoing support at the end of the year.
Many clients had long periods of support or even multiple support periods during 2019–20. They may have had a number of changes in their housing situation over the course of their support. These changes within the year are not reflected in the data presented here, rather the client situation at the start of their first support period in 2019–20 is compared with the end of their last support period in 2019–20. A proportion of these clients may have sought assistance prior to 2019–20, and may again in the future.
At the end of the reporting period in 2019–20:
- The proportion of children on a CPO who were known to be homeless decreased from 47% at the beginning of support to 34% at the end of support; more than 600 fewer clients were homeless following support (Table CPO.4).
- The shift in the proportion of couch surfers accounted for much of the decrease in the proportion of clients who were homeless; the proportion of clients living in a house, townhouse or flat as a ‘couch surfer’ with no tenure decreased from 17% to 11% following support, while the proportion staying in short-term temporary accommodation decreased from 25% to 21%.
- The largest change at the end of support was in the proportion of clients living in public or community housing, which increased from 17% to 26% at the end of support (or nearly 500 clients).
These trends demonstrate that by the end of support, many clients have achieved or progressed towards a more positive housing solution. That is, clients ending support in public or community housing (renter or rent-free) or private or other housing (renter or rent-free) had increased compared with the start of support.
|
Housing situation |
Beginning of support |
End of |
Beginning of support |
End of |
|---|---|---|---|---|
|
No shelter or improvised/inadequate dwelling |
249 |
121 |
5.0 |
2.5 |
|
Short term temporary accommodation |
1,238 |
1,036 |
24.8 |
21.1 |
|
House, townhouse or flat - couch surfer or with no tenure |
838 |
528 |
16.8 |
10.8 |
|
Total homeless |
2,325 |
1,685 |
46.5 |
34.4 |
|
Public or community housing - renter or rent free |
824 |
1,294 |
16.5 |
26.4 |
|
Private or other housing - renter, rent free or owner |
1,781 |
1,871 |
35.6 |
38.2 |
|
Institutional settings |
72 |
54 |
1.4 |
1.1 |
|
Total at risk |
2,677 |
3,219 |
53.5 |
65.6 |
|
Total clients with known housing situation |
5,002 |
4,904 |
100.0 |
100.0 |
|
Not stated/other |
873 |
971 |
|
|
|
Total clients |
5,875 |
5,875 |
|
|
Notes:
- Percentages have been calculated using total number of clients as the denominator (less not stated/other).
- It is important to note that individual clients beginning support in one housing type need not necessarily be the same individuals ending support in that housing type.
- Not stated/other includes those clients whose housing situation at either the beginning or end of support was unknown.
Source: Specialist Homelessness Services Collection. Supplementary table CPO.4.
Housing outcomes for homeless versus at risk clients
In 2019–20, 4,600 children on a CPO had a known housing status at both the start and end of support. Of these clients, more than 2,500 clients were at risk of homelessness at the start of support. By the end of support (Figure CPO.1):
- Almost half (1,200 clients or 48%) maintained private housing
- Nearly 800 clients (31%) were in public housing.
Figure CPO.1: Housing situation for clients with closed support who began support at risk of homelessness, 2019–20
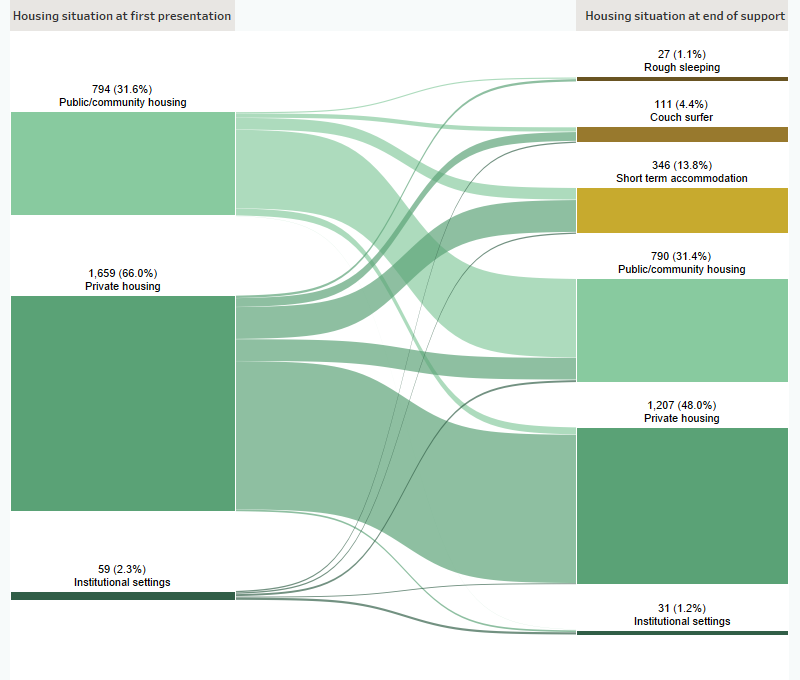
Notes:
- Excludes clients with unknown housing situation.
- Includes only those clients who ceased receiving support during the financial year (meaning that their support period(s) had closed and they were not in ongoing support at the end of the year).
Source: Specialist Homelessness Services Collection, 2019–20
For clients who were known to be homeless at the start of support (just over 2,100 clients) (Figure CPO.2):
- Over 600 clients (29%) ended support in short term accommodation
- Nearly 600 (27%) ended support in private housing
- Almost 400 clients (18%) were couch surfing at the end of support.
Figure CPO.2: Housing situation for clients with closed support who were experiencing homelessness at the start of support, 2019–20
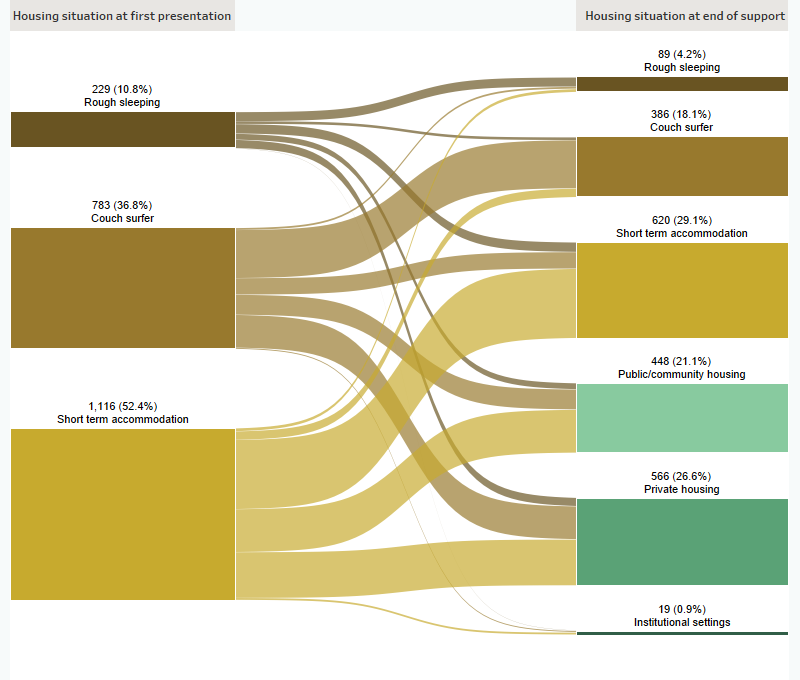
Notes:
- Excludes clients with unknown housing situation.
- Includes only those clients who ceased receiving support during the financial year (meaning that their support period(s) had closed and they were not in ongoing support at the end of the year).
Source: Specialist Homelessness Services Collection, 2019–20
References
AIHW (Australian Institute of Health and Welfare) 2016. Vulnerable young people: interactions across homelessness, youth justice and child protection—1 July 2011 to 30 June 2015. Cat. no. HOU 279. Canberra: AIHW.
AIHW (Australian Institute of Health and Welfare) 2020. Child protection Australia 2018–19. Cat. no. CWS 75. Canberra: AIHW.
CFFR (Council on Federal Financial Relations) 2018. National Housing and Homelessness Agreement. Viewed 3 October 2019.
MICAH Projects 2016. Families caught in the homelessness and child protection cycle: a supportive housing model for keeping families together. Brisbane: Common Ground Queensland.
Noble-Carr D & Trew S 2018. Nowhere to go: investigating homelessness experiences of 12–15 year olds in the Australian Capital Territory. Canberra: Institute of Child Protection Studies, Australian Catholic University.