Service geography
On this page
Access to services can become increasingly difficult the further away a client is from a major city (ABS 2018). For Specialist Homelessness Services (SHS), state and territory systems for the assessment, intake, referral and ongoing case management of SHS clients vary, ranging from agency-based to centralised management models (PC 2019). This section provides an overview of the geographical distribution of SHS support services provided across Australia, based on the location of the agency.
Key findings
- Agency client numbers increased by nearly 2,000 clients in Remote/Very remote areas from 2018–19 to 2019–20, while numbers in other areas decreased.
- Agencies in Inner regional areas had the greatest decrease in client numbers (over 1,000 clients).
- The housing situation of clients presenting to SHS agencies was different between remoteness areas, with most clients receiving support from services in Remote/Very remote areas (72%) at risk of homelessness, compared with just half for all other areas (56–57%).
- The rate of clients receiving support was highest in Remote or Very remote areas, 1 in 30 people compared with over 1 in 100 in Major cities and 1 in 68 and 1 in 65 in Inner and Outer regional areas respectively in 2019–20.
Reporting service location in the Specialist Homelessness Services Collection (SHSC)
This section examines client service needs and characteristics based on the location of the SHS agency, where the service was received, that is, the profile of clients receiving support as provided by services in specific areas. Clients can access services in more than one remoteness area, however, for the purpose of the analysis, clients are assigned to one Remoteness Area based on the SHS agency where they first sought support in 2019–20. The 2016 Australian Statistical Geography Standard (ASGS) (ABS 2018) is used to classify agencies by Remoteness Area based on the location details of each agency (see Technical information).
State-wide SHS operate in some states/territories and can assist a high number of clients over the phone. Therefore, service location data may not be accurate or relevant for some clients.
In interpreting regional service trends throughout this section, ‘urban areas’ refer to Major cities and Inner and Outer regional areas and ‘remote areas’ refer to Remote and Very remote areas, unless otherwise stated.
Specialist homelessness services across urban and remote areas
In 2019–20, clients seeking assistance from SHS agencies in urban and remote areas displayed distinct characteristics:
- The proportion of people who were homeless upon presentation was lower among the clients receiving support from services in Remote areas (28%) compared with Major cities (44%) (Table REG.5).
- The median length of accommodation received by clients of services in Major cities was 39 nights, compared with 4 nights in Remote areas (Table REG.2).
- Over 9 in 10 clients (93%) seeking services in Remote or Very remote areas identified as Aboriginal or Torres Strait Islander (Supplementary table INDIGENOUS.5).
- Almost 9 in 10 (86%) SHS clients born overseas were located in Major cities (Supplementary table CLIENTS.6).
- Of those clients with a current mental health issue (around 88,300 clients), almost 2 in 3 (65%) presented to agencies for assistance in Major cities (Supplementary table MH.11).
- The most common main reasons clients sought assistance across Remoteness Areas (Supplementary table REG.1) were:
- Major cities: family and domestic violence (30%), followed by housing crisis (18%).
- Inner and Outer regional areas: family and domestic violence (27% and 24% respectively) and housing crisis (17% and 20% respectively).
- Remote areas: family and domestic violence (34%) and time out from family/other situation (8%).
Trends over time
Some key geographically based service trends between 2015–16 and 2019–20 (Table REG.1 and Table REG.2) include:
- Taking into account population differences, agencies in Remote areas consistently reported the highest rate of SHS clients. The rate of SHS clients accessing services located in Remote/Very Remote areas was 3.5 times higher than in Major cities in 2019–20, up from 2.6 times in 2015–16.
- Over the period, SHS support in Remote areas provided accommodation to 3 in 5 clients each year (60%). This was higher than the proportion of clients provided with accommodation in urban areas (around 30%).
|
Year |
Major cities |
Inner regional |
Outer regional |
Remote/ |
|||
|---|---|---|---|---|---|---|---|
|
Number of clients (proportion (per cent) of all clients) |
|||||||
|
2019–20 |
Number |
175,726 |
66,597 |
31,629 |
16,510 |
||
|
|
Per cent |
60 |
23 |
11 |
6 |
||
|
2018–19 |
Number |
176,507 |
67,607 |
31,676 |
14,527 |
||
|
|
Per cent |
61 |
23 |
11 |
5 |
||
|
2017–18 |
Number |
179,323 |
65,671 |
30,352 |
13,449 |
||
|
|
Per cent |
62 |
23 |
11 |
5 |
||
|
2016–17 |
Number |
178,197 |
65,330 |
31,131 |
13,614 |
||
|
|
Per cent |
62 |
23 |
11 |
5 |
||
|
2015–16 |
Number |
174,744 |
60,013 |
30,790 |
13,650 |
||
|
|
Per cent |
63 |
21 |
11 |
5 |
||
|
Rate (per 10,000 population) |
|||||||
|
2019–20 |
|
95.9 |
148.0 |
153.9 |
339.3 |
||
|
2018–19 |
|
98.1 |
152.1 |
154.4 |
298.2 |
||
|
2017–18 |
|
101.5 |
149.6 |
148.2 |
275.4 |
||
|
2016–17 |
|
103.5 |
148.9 |
149.1 |
277.4 |
||
|
2015–16 |
|
103.4 |
138.6 |
147.8 |
273.4 |
||
Notes:
-
Rates are crude rates based on the Australian estimated resident population (ERP) at 30 June of the reference year. Minor adjustments in rates may occur between publications reflecting revision of the estimated resident population by the Australian Bureau of Statistics.
- Previous years’ data can be found in the 2018-19 Specialist Homelessness Services Annual report.
- Data for 2015–16 to 2016–17 have been adjusted for non-response. Due to improvements in the rates of agency participation and SLK validity, data from 2017–18 are not weighted. The removal of weighting does not constitute a break in time series and weighted data from 2015–16 to 2016–17 are comparable with unweighted data for 2017–18 onwards. For further information, please refer to the Technical Notes.
Source: Specialist Homelessness Services Collection 2015–16 to 2019–20.
|
Year |
Major cities |
Inner regional |
Outer regional |
Remote/ |
|
|---|---|---|---|---|---|
|
Length of support (median number of days) |
|||||
|
2019–20 |
|
42 |
58 |
38 |
15 |
|
2018–19 |
|
40 |
58 |
40 |
19 |
|
2017–18 |
|
35 |
53 |
39 |
20 |
|
2016–17 |
|
34 |
46 |
37 |
20 |
|
2015–16 |
|
33 |
41 |
36 |
17 |
|
Average number of support periods per client |
|||||
|
2019–20 |
|
1.9 |
1.6 |
1.6 |
1.6 |
|
2018–19 |
|
1.8 |
1.6 |
1.5 |
1.6 |
|
2017–18 |
|
1.8 |
1.6 |
1.5 |
1.6 |
|
2016–17 |
|
1.8 |
1.6 |
1.5 |
1.6 |
|
2015–16 |
|
1.7 |
1.6 |
1.5 |
1.5 |
|
Proportion receiving accommodation |
|||||
|
2019–20 |
|
29 |
23 |
32 |
60 |
|
2018–19 |
|
28 |
25 |
33 |
63 |
|
2017–18 |
|
27 |
25 |
36 |
62 |
|
2016–17 |
|
28 |
25 |
37 |
59 |
|
2015–16 |
|
29 |
27 |
39 |
62 |
|
Median number of nights accommodated |
|||||
|
2019–20 |
|
39 |
35 |
21 |
4 |
|
2018–19 |
|
40 |
33 |
24 |
5 |
|
2017–18 |
|
46 |
34 |
23 |
5 |
|
2016–17 |
|
48 |
31 |
24 |
5 |
|
2015–16 |
|
48 |
34 |
23 |
5 |
Notes:
- Previous years’ data can be found in 2018–19 Specialist Homelessness Services Annual report.
- Data for 2015–16 to 2016–17 have been adjusted for non-response. Due to improvements in the rates of agency participation and SLK validity, data from 2017–18 are not weighted. The removal of weighting does not constitute a break in time series and weighted data from 2015–16 to 2016–17 are comparable with unweighted data for 2017–18 onwards. For further information, please refer to the Technical Notes.
Source: Specialist Homelessness Services Collection 2015–16 to 2019–20.
Services needed and provided
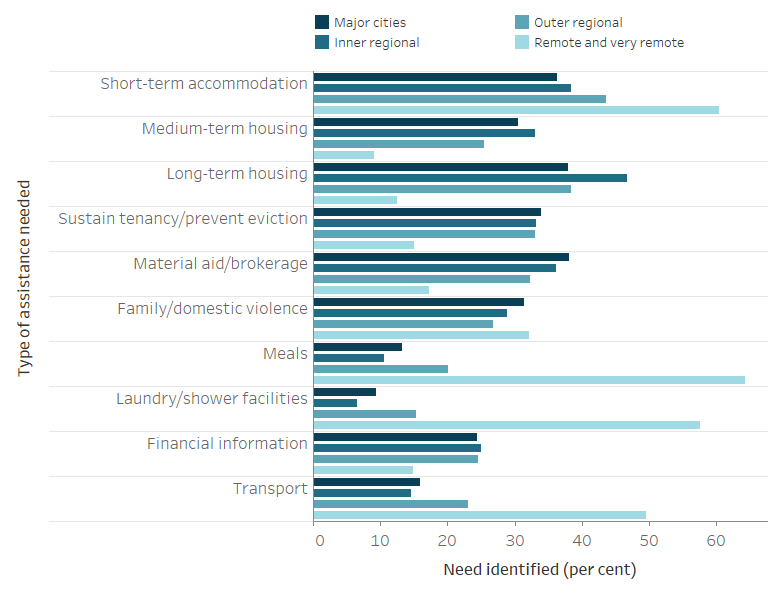
In 2019–20 (Figure REG.1; Supplementary Table REG.4):
- The proportion of clients needing short-term or emergency accommodation was highest for services in more remote areas: Major cities 36%, Inner regional areas 38%, Outer regional areas 44%, and Remote/Very remote areas 60%.
- Just under half of clients of Inner regional services (47%) needed long-term housing compared with 38% in Major cities.
- Nearly 9 in 10 (89%) requests for accommodation were met by services in remote areas, while clients of services in Major cities and Inner regional areas were less likely to receive accommodation (51% and 38% of services provided, respectively).
- Referral rates for accommodation were lowest in Remote/Very remote areas (3%) compared with all other areas (15% to 18%).
- Clients in Remote and Very remote areas were more likely to receive short-term or emergency accommodation (93%) than those in Major cities (58%) and Inner regional (47%) areas.
- Need for mental health services was higher among clients of services in Major cities (11% or over 19,100 clients) and Inner regional areas (9% or over 6,200 clients) than those in Outer regional areas (7% or nearly 2,300 clients) and remote/very remote areas (4% or around 700 clients).
Figure REG.1: Clients by most needed services, by remoteness area, 2019–20
Notes:
- Most needed excludes 'General services', 'Other basic assistance', 'Advice/information' and 'Advocacy/liaison on behalf of client'.
- Short-term accommodation includes temporary and emergency accommodation; medium-term housing includes transitional housing; and sustain tenancy/prevent eviction includes assistance to sustain tenancy or prevent tenancy failure or eviction.
- Proportions have been calculated using the client count for each remoteness area as the denominator
Source: Specialist Homelessness Services Collection 2019–20, Supplementary table REG.4.
Outcomes at the end of support
Outcomes presented here describe the change in clients’ housing situation between the start and end of support during 2019–20. Data are limited to clients who ceased receiving support during the financial year—meaning that their support periods had closed and they did not have ongoing support at the end of the year.
Many clients had long periods of support or even multiple support periods during 2019–20. They may have had a number of changes in their housing situation over the course of their support. These changes within the year are not reflected in the data presented here, rather the client situation at the start of their first support period in 2019–20 is compared with the end of their last support period in 2019–20. A proportion of these clients may have sought assistance prior to 2019–20, and may again in the future (Table REG.3).
- Clients accessing services in Outer regional areas were the least likely to end support in housing (including institutions) (66%), noting that this group also had the a similar proportion presenting to SHS experiencing homelessness (44%) as clients in Major cities (44%) and Inner regional areas (43%).
- Clients of Inner regional services were the most likely to be housed in private or other housing following support (49%). They were also the most likely to improve their housing situation following SHS assistance with 70% housed at the end of support, up 13 percentage points from the beginning of support.
- Clients accessing agencies in Remote and Very remote areas were more likely to report living in public or community housing (62%) at the beginning of their support. The majority of clients (76%) were in housing at the end of support.
|
Housing situation |
Beginning of support |
End of |
Beginning of support |
End of |
|---|---|---|---|---|
|
Major cities |
||||
|
No shelter or improvised/inadequate dwelling |
11,333 |
6,169 |
10.2 |
5.7 |
|
Short term temporary accommodation |
20,287 |
18,105 |
18.2 |
16.7 |
|
House, townhouse or flat - couch surfer or with no tenure |
17,044 |
11,027 |
15.3 |
10.2 |
|
Total homeless |
48,664 |
35,301 |
43.6 |
32.6 |
|
Public or community housing - renter or rent free |
11,941 |
18,039 |
10.7 |
16.6 |
|
Private or other housing - renter, rent free or owner |
46,519 |
51,802 |
41.7 |
47.8 |
|
Institutional settings |
4,438 |
3,281 |
4.0 |
3.0 |
|
Total at risk |
62,898 |
73,122 |
56.4 |
67.4 |
|
Total clients with known housing situation |
111,562 |
108,423 |
100.0 |
100.0 |
|
Not stated/other |
21,880 |
25,019 |
|
|
|
Total clients |
133,442 |
133,442 |
|
|
|
Inner regional |
||||
|
No shelter or improvised/inadequate dwelling |
4,359 |
2,683 |
10.0 |
6.3 |
|
Short term temporary accommodation |
5,989 |
4,469 |
13.8 |
10.6 |
|
House, townhouse or flat - couch surfer or with no tenure |
8,391 |
5,556 |
19.3 |
13.1 |
|
Total homeless |
18,739 |
12,708 |
43.1 |
30.0 |
|
Public or community housing - renter or rent free |
5,150 |
8,033 |
11.8 |
19.0 |
|
Private or other housing - renter, rent free or owner |
17,995 |
20,526 |
41.3 |
48.5 |
|
Institutional settings |
1,638 |
1,062 |
3.8 |
2.5 |
|
Total at risk |
24,783 |
29,621 |
56.9 |
70.0 |
|
Total clients with known housing situation |
43,522 |
42,329 |
100.0 |
100.0 |
|
Not stated/other |
7,007 |
8,200 |
|
|
|
Total clients |
50,529 |
50,529 |
|
|
|
Outer regional |
||||
|
No shelter or improvised/inadequate dwelling |
2,166 |
1,205 |
9.6 |
5.5 |
|
Short term temporary accommodation |
3,100 |
3,020 |
13.7 |
13.7 |
|
House, townhouse or flat - couch surfer or with no tenure |
4,596 |
3,231 |
20.4 |
14.7 |
|
Total homeless |
9,862 |
7,456 |
43.7 |
33.8 |
|
Public or community housing - renter or rent free |
4,095 |
5,449 |
18.1 |
24.7 |
|
Private or other housing - renter, rent free or owner |
7,837 |
8,519 |
34.7 |
38.6 |
|
Institutional settings |
783 |
623 |
3.5 |
2.8 |
|
Total at risk |
12,715 |
14,591 |
56.3 |
66.2 |
|
Total clients with known housing situation |
22,577 |
22,047 |
100.0 |
100.0 |
|
Not stated/other |
2,258 |
2,788 |
|
|
|
Total clients |
24,835 |
24,835 |
|
|
|
Remote and very remote |
||||
|
No shelter or improvised/inadequate dwelling |
407 |
227 |
3.6 |
2.0 |
|
Short term temporary accommodation |
1,569 |
1,515 |
13.8 |
13.5 |
|
House, townhouse or flat - couch surfer or with no tenure |
1,213 |
999 |
10.7 |
8.9 |
|
Total homeless |
3,189 |
2,741 |
28.1 |
24.4 |
|
Public or community housing - renter or rent free |
6,985 |
7,122 |
61.6 |
63.5 |
|
Private or other housing - renter, rent free or owner |
1,023 |
1,222 |
9.0 |
10.9 |
|
Institutional settings |
146 |
135 |
1.3 |
1.2 |
|
Total at risk |
8,154 |
8,479 |
71.9 |
75.6 |
|
Total clients with known housing situation |
11,343 |
11,220 |
100.0 |
100.0 |
|
Not stated/other |
2,498 |
2,621 |
|
|
|
Total clients |
13,841 |
13,841 |
|
|
Notes:
- Percentages have been calculated using total number of clients as the denominator (less not stated/other).
- It is important to note that individual clients beginning support in one housing type need not necessarily be the same individuals ending support in that housing type.
- Not stated/other includes those clients whose housing situation at either the beginning or end of support was unknown.
Source: Specialist Homelessness Services Collection. Supplementary table REG.5.
Housing outcomes for homeless versus at risk clients
For clients with a known housing status who were at risk of homelessness at the start of support, by the end of support (Interactive Tableau visualisation and Supplementary table REG.5):
- Most clients in Major cities (38,000 clients or 64%) were in private housing.
- Most clients in Inner regional areas (14,600 clients or 62%) were in private housing.
- Most clients in Outer regional areas (6,200 clients or 51%) were in private housing, with an additional 27% (3,300 clients) in public or community housing.
- Most clients in Remote or Very remote areas (6,100 clients or 77%) were in public or community housing.
For clients who were known to be homeless at the start of support, at the end of support:
- In Major cities: 13,400 clients (31%) were in short-term accommodation.
- In Inner regional areas: 4,500 clients (26%) were in private housing and another 4,500 clients were couch surfing.
- In Outer regional areas: 2,700 clients (29%) were couch surfing.
- In Remote and Very remote areas: 980 clients (33%) were in short-term accommodation.
References
ABS (Australian Bureau of Statistics) 2018. Australian Statistical Geography Standard (ASGS): Volume 5—Remoteness structure, July 2016. ABS cat. no. 1270.0.55.005. Canberra: ABS.
PC (Productivity Commission) 2019. Report of Government Services 2019: Part G, Section 19: Homelessness Services. Canberra: PC.