Clients experiencing domestic and family violence
Domestic and family violence is the main reason women and children leave their homes in Australia [1] and has consistently been one of the most common reasons clients have sought assistance from specialist homelesssness agencies (see Clients, services and outcomes).
In 2014–15, 36% of all people requesting assistance from specialist homelessness agencies were escaping domestic or family violence (92,000 clients). This included 31,000 children aged under 18 and 56,000 adult females.
Clients experiencing domestic and family violence: trends over time
Since the beginning of the SHS collection in 2011–12, the number of clients who had experienced domestic and family violence has increased. Key trends identified over these 4 years have been:
- Nationally the number of clients who had experienced domestic and family violence and sought assistance from specialist homelessness agencies has increased 16% since 2011–12. The majority of these additional clients requesting assistance for domestic and family violence were single parent households (with a child or children).
- This increase is due predominantly to increases in client numbers in Victoria where there has been, on average, a 15% increase each year. This increase in domestic and family violence clients is the result of more services being provided in Victoria.
- The proportion of clients who were homeless upon presentation has increased, from 33% in 2011–12 to 37% in 2014–15.
- The proportion ending support with improved housing outcomes has increased, particularly for those in private rental or owners.
| 2011–12 | 2012–13 | 2013–14 | 2014–15 | |
|---|---|---|---|---|
| Number of clients (proportion of all clients) | 79,611 (34%) | 77,870 (32%) | 84,774 (33%) | 92,349 (36%) |
| Rate (per 10,000 population) | 36 | 34 | 37 | 39 |
| Housing situation at the beginning of first support period (all clients) | ||||
| Homeless: At risk of homelessness | 33%:67% | *35%: 65% | *37%: 63% | 37%: 63% |
| Living arrangement | ||||
| Lone person | 17% | 19% | 18% | 17% |
| Sole parent | 43% | 43% | 46% | 47% |
| Couple with child/ren | 16% | 15% | 14% | 14% |
| Couple without children | 6% | 6% | 5% | 5% |
| Other family group | 18% | 18% | 17% | 17% |
| Main reason for seeking assistance (Top 4) | ||||
| Domestic and family violence | 72% | 69% | 70% | 70% |
| Housing crisis | 6% | 6% | 7% | 9% |
| Relationship/family breakdown | 5% | 5% | 5% | 4% |
| Inadequate or inappropriate dwelling conditions | 4% | 5% | 5% | 4% |
| Proportion receiving accommodation (median (nights)) | 43% (34) | *45% (32) | *44% (34) | 41% (32) |
| Number of support periods (average per client) | 126,270 (1.6) | 137,896 (1.8) | 150,205 (1.8) | 168,274 (1.8) |
| Average (median) length of support (days) | 93 (37) | 98 (40) | *96 (43) | 86 (40) |
| Proportion of a client group with a case management plan | 63% | *62% | *63% | 64% |
| Achievement of all case management goals | 18% | 16% | *17% | 22% |
Notes
-
Rates are crude rates based on the Australian estimated resident population (ERP) at 30 June of the reference year.
-
* Indicates where previously published data have been revised to ensure consistent reporting over time. 2011–12 data were revised in December 2013 but not previously reported in this format.
-
The denominator for the proportion achieving all case management goals is the number of client groups with a case management plan. Denominator values for proportions are provided in the relevant national supplementary table.
Source: Specialist homelessness services Annual Reports 2011–12, 2012–13, 2013–14 and 2014–15.
-
In 2014–15 there were over 7,500 more clients seeking assistance for domestic and family violence.
-
This increase was largely due to more domestic and family violence clients in Victoria (nearly 5,700 clients) and Western Australia (about 1,200).
-
Nearly half of all clients (47%) seeking assistance for domestic and family violence were living in single parent households (with a child or children).
-
Sixty-three percent were at risk of homelessness when first presenting for support.
In 2014–15 changes occurred in the way agencies are required to report 'main reason' and 'reasons for seeking assistance'. Comparisons over time should be made with caution as the reporting of housing crisis, financial difficulties and housing affordability stress may be inconsistent between agencies. See Technical information for further details.
Age and sex
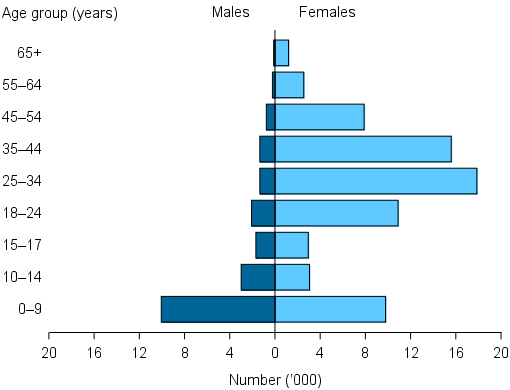
The majority of clients of specialist homelessness services who were escaping domestic and family violence were females and children (Figure DV.1). In particular:
- Females aged 15 and over accounted for 64% of this group.
- Children aged 14 and under accounted for an additional 28% (or about 26,000).
- Males aged 15 and older accounted for 8% of the client group.
- Among children aged 0–9 years, there were similar numbers of boys and girls, totalling about 20,000 children.
Figure DV.1: Clients who have experienced domestic and family violence, by age and sex, 2014–15
Source: Specialist homelessness services 2014–15, National supplementary table DV.1 (702KB XLS).
Services needed and provided
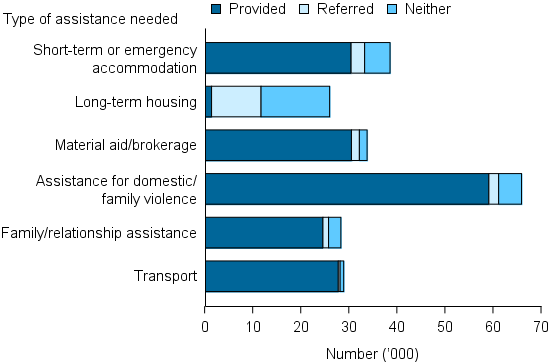
38,580
clients escaping domestic and family violence needed short term or emergency accommodation.
Clients who had experienced domestic and family violence were most commonly recorded as needing assistance for domestic/family violence (71%). The next most common services that were identified as a need for assistance were (Figure DV.2):
- short-term or emergency accommodation (42%)
- material aid/brokerage (37%)
- family/relationship assistance (31%)
- transport (31%)
- long term housing (28%).
Of the persons identified as needing assistance for domestic and family violence, 90% were provided assistance.
Figure DV.2: Clients who have experienced domestic and family violence, by most needed services and service provision status, 2014–15
Note: Excludes 'Other basic assistance', 'Advice/information', and 'Advocacy/liaison on behalf of client'.
Source: Specialist homelessness services 2014–15, National supplementary table DV.3 (702KB XLS).
Housing outcomes
Of clients who experienced domestic and family violence with closed support periods, at the start of support:
- 61% were at risk of homelessness
- most (42%) were living in private rental accommodation (either as a renter or rent free).
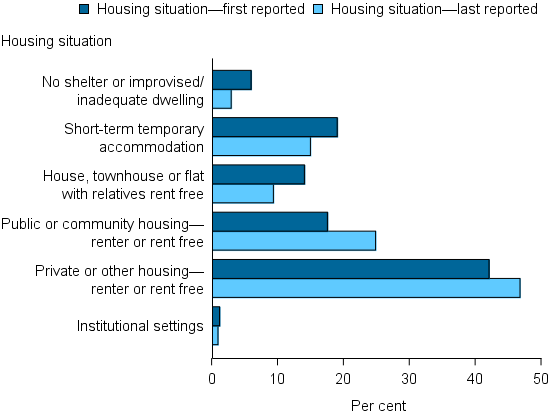
The housing outcomes for those clients with closed support who had experienced domestic or family violence showed that (Figure DV.3):
- the proportion that were homeless decreased to 28% (from 39% at the beginning of their support)
- this decrease was particularly evident for those living in a house/townhouse or flat with no tenure (14% down to 9% after support)
- the largest improvement in housing situation at the end of support was for clients in public or community housing—up from 18% at the start of support to 25% at the end of support.
Figure DV.3: Clients who have experienced domestic and family violence and who had closed support, by housing situation at the beginning and end of support, 2014–15
Source: Specialist homelessness services 2014–15, National supplementary table DV.4 (702KB XLS).
Reference
- Spinney A, 2012. Home and safe? Policy and practice innovations to prevent women and children who have experienced domestic and family violence from becoming homeless. Final report no. 196. Melbourne: Australian Housing and Urban Research Institute.