Older clients
People aged 55 or older comprised 7% of all clients (18,741 people) of specialist homelessness services in 2014–15. Specialist homelessness service use by this group is increasing with numbers up 25% since the collection began in 2011–12.
Older clients: trends over time
Since the beginning of the SHS collection in 2011–12 the number of older clients seeking assistance from specialist homelessness services has increased. Key trends identified in this client population over the 4 years are:
- The rate of service use by older clients has increased from 7 older clients per 10,000 population to 8 per 10,000.
- This group represents one of the growing populations seeking assistance from specialist homelessness agencies. While the proportion of older clients is small (7% in 2014–15) this client group has experienced an average annual growth rate of 8% each year.
- The median number of days older clients need support has increased, suggesting these clients are presenting with potentially more complex issues taking longer to resolve and are having greater difficulty in finding suitable housing.
| 2011–12 | 2012–13 | 2013–14 | 2014–15 | |
|---|---|---|---|---|
| Number of clients (proportion of all clients) | 15,052 (6%) | 17,193 (7%) | 18,182 (7%) | 18,741 (7%) |
| Rate (per 10,000 population) | 6.7 | 7.6 | 7.9 | 8.0 |
| Housing situation at the beginning of first support period (all clients) | ||||
| Homeless: At risk of homelessness | 31%: 69% | *33%: 67% | *33%: 67% | 33%: 67% |
| Living arrangement | ||||
| Lone person | 61% | 61% | 60% | 59% |
| Sole parent | 7% | 7% | 8% | 8% |
| Couple with child/ren | 4% | 4% | 4% | 5% |
| Couple without children | 12% | 11% | 11% | 11% |
| Other family group | 16% | 16% | 17% | 18% |
| Main reason for seeking assistance (Top 3) | ||||
| Financial difficulties | 22% | 22% | 21% | 18% |
| Domestic and family violence | 17% | 15% | 17% | 18% |
| Housing crisis | 11% | 14% | 15% | 18% |
| Proportion receiving accommodation (median (nights)) | 22% (30) | 22% (34) | *21% (33) | 20% (31) |
| Number of support periods (average per client) | 20,222 (1.3) | 25,875 (1.5) | 26,731 (1.5) | 27,811 (1.5) |
| Average (median) length of support (days) | 64 (17) | 71 (18) | *69 (21) | 66 (24) |
| Proportion of a client group with a case management plan | 47% | *42% | *45% | 49% |
| Achievement of all case management goals | 30% | 30% | *30% | 31% |
Notes
-
Rates are crude rates based on the Australian estimated resident population (ERP) at 30 June of the reference year.
-
* Indicates where previously published data have been revised to ensure consistent reporting over time. 2011–12 data were revised in December 2013 but not previously reported in this format.
-
The denominator for the proportion achieving all case management goals is the number of client groups with a case management plan. Denominator values for proportions are provided in the relevant national supplementary table.
Source: Specialist homelessness services Annual Reports 2011–12, 2012–13, 2013–14 and 2014–15.
Characteristics of older clients
Similar numbers of male and female
older clients sought support from specialist homelessness agencies in 2014–15.
- In 2014–15 older clients were more likely than the broader SHS population to be male (46% compared with 41% of all clients). This group had a much larger proportion of lone persons compared with younger age groups.
- Of older clients, two-thirds were aged 55–64 (66%) and the remaining one-third was 65 or over.
- Only 4% of Indigenous clients were aged over 55 compared with 8% of non-Indigenous clients.
- Older clients were less likely to be homeless on presentation than younger clients. For example, 33% of clients aged 55 and over were homeless on presentation compared with 43% of the broader SHS population.
- For older clients there were 3 main reasons most commonly reported for seeking assistance: financial difficulties, domestic and family violence and housing crisis (all 18%).
In 2014–15 changes occurred in the way agencies are required to report 'main reason' and 'reasons for seeking assistance'. Comparisons over time should be made with caution as the reporting of housing crisis, financial difficulties and housing affordability stress may be inconsistent between agencies. See Technical information for further details.
Services needed and provided
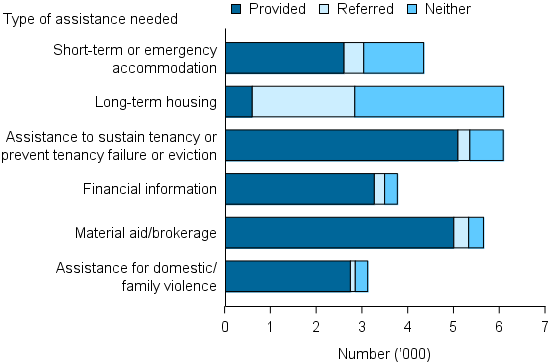
- Older clients were less likely to request accommodation services (45%) than the broader SHS population (56%). Of those who did request accommodation, most needed long term housing (33%); they were more likely to be provided with this form of accommodation (10% of those who requested it) compared with the general SHS population (6%).
Other services most commonly needed by older clients were for:
- assistance to sustain tenancy or prevent tenancy failure or eviction (32%)
- material aid/brokerage (30%)
- short-term or emergency accommodation (23%) (Figure OLDER.1).
Figure OLDER.1: Older clients by most needed services and service provision status (top 6), 2014–15

Note: Excludes 'Other basic assistance', 'Advice/information', and 'Advocacy/liaison on behalf of client'.
Source: Specialist homelessness services 2014–15, National supplementary table OLDER.3 (702KB XLS).
Housing outcomes
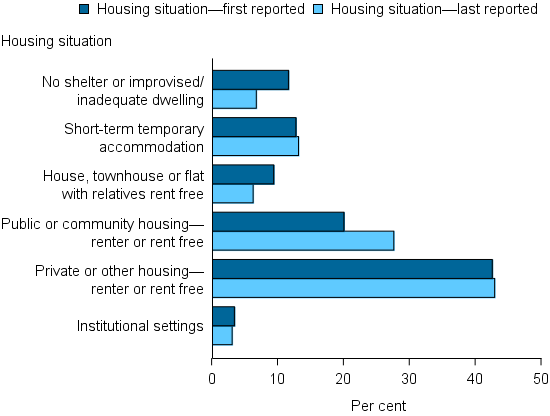
The most common housing outcomes for older clients with closed support periods were in:
- public or community housing (28%)—an increase from 20% at the beginning of support (Figure OLDER.2)
- no shelter or improvised/inadequate dwelling (12% at beginning of support)—this reduced to 7% at the end of support.
Figure OLDER.2: Older clients with closed support, by housing situation at beginning of support and end of support, 2014–15

Source: Specialist homelessness services 2014–15, National supplementary table OLDER.4 (702KB XLS).


