Young people presenting alone
Young people experience significant rates of homelessness [1] and this experience as a young person has been identified as one of the major pathways into longer term homelessness for adults [2].
In 2014–15
41,780 young people
aged 15–24 approached specialist homelessness agencies alone; over half of them were homeless (52%).
Young people presenting alone: trends over time
Over the 4 years since the beginning of the SHS collection in 2011–12 the number of young people presenting alone to an agency has fluctuated. Key trends over these 4 years have been:
- The rate of service use by young people presenting alone to SHS agencies has decreased from 20 young people per 10,000 population in 2011–12 to 18 young people per 10,000 in 2014–15.
- Domestic and family violence or housing crisis remain the most common main reasons why young people presenting alone are seeking assistance.
- The median length of support for these clients has increased.
In 2014–15 changes occurred in the way agencies are required to report 'main reason' and 'reasons for seeking assistance'. Comparisons over time should be made with caution as the reporting of housing crisis, financial difficulties and housing affordability stress may be inconsistent between agencies. See Technical information for further details.
| 2011–12 | 2012–13 | 2013–14 | 2014–15 | |
|---|---|---|---|---|
| Number of clients (proportion of all clients) | 43,531 (18%) | 45,071 (18%) | 44,414 (17%) | 41,780 (16%) |
| Rate (per 10,000 population) | 20 | 20 | 19 | 18 |
| Housing situation at the beginning of first support period (all clients) | ||||
| Homeless: At risk of homelessness | 50%: 50% | *51%: 49% | *50%: 50% | 52%: 48% |
| Living arrangement | ||||
| Lone person | 39% | 38% | 38% | 39% |
| Sole parent | 16% | 16% | 16% | 15% |
| Couple with child/ren | 7% | 8% | 8% | 8% |
| Couple without children | 6% | 7% | 7% | 7% |
| Other family group | 32% | 31% | 31% | 30% |
| Main reason for seeking assistance (Top 3) | ||||
| Housing crisis | 15% | 16% | 16% | 21% |
| Domestic and family violence | 16% | 15% | 15% | 15% |
| Relationship/family breakdown | 14% | 13% | 13% | 12% |
| Proportion receiving accommodation (median (nights)) | 39% (35) | 37% (36) | *36% (41) | 35% (41) |
| Number of support periods (average per client) | 69,096 (1.6) | 77,028 (1.7) | 76,157 (1.7) | 74,274 (1.8) |
| Average (median) length of support (days) | 88 (35) | 96 (41) | *98 (46) | 92 (44) |
| Proportion of a client group with a case management plan | 54% | *54% | 57% | 58% |
| Achievement of all case management goals | 16% | 16% | *17% | 20% |
Notes
- Rates are crude rates based on the Australian estimated resident population (ERP) at 30 June of the reference year.
- * Indicates where previously published data have been revised to ensure consistent reporting over time. 2011–12 data were revised in December 2013 but not previously reported in this format.
- The denominator for the proportion achieving all case management goals is the number of client groups with a case management plan. Denominator values for proportions are provided in the relevant national supplementary table.
Source: Specialist homelessness services Annual Reports 2011–12, 2012–13, 2013–14 and 2014–15.
-
In 2014–15 16% of all clients (41,780 people) accessing specialist homelessness services were young people (aged 15–24) who presented alone. This represents a 6% reduction in client numbers compared with 2013–14 and a trend observed in all states and territories.
-
For 39% of these clients they lived alone at the time of approaching a specialist homelessness agency and a further 15% lived as a couple, either with or without children.
-
The majority of young people presenting alone were female (63%) and 79% were aged between 18 and 24.
Services needed and provided
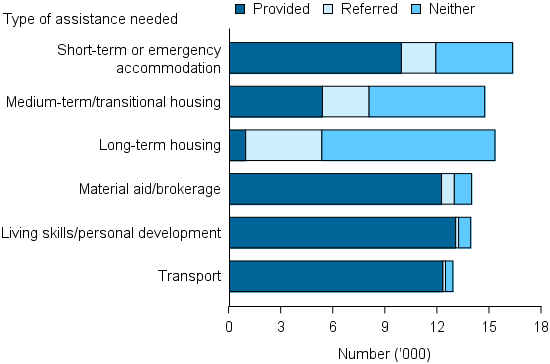
- For young people presenting alone, the most common needs identified were accommodation related, including short-term or emergency accommodation (39% or over 16,000 clients), medium-term/transitional housing (35%) and long-term accommodation (37%) (Figure YOUNG.1).
- Sixty-one per cent of young people presenting alone with an identified need for short term or emergency housing were provided assistance. This proportion is lower than the general SHS client population (66%).
- Compared with the overall SHS population, young people presenting alone were more likely to be identified as needing assistance with living skills/personal development (33% compared with 20%), education (19% compared with 9%), employment (13% compared with 5%) and training (12% compared with 5%).
- The need for these services was unmet in some cases (20% for those who identified needs for education, 26% for employment and 27% for training assistance).
Figure YOUNG.1: Young people presenting alone, by top 6 most needed services and service provision status, 2014–15

Note: Excludes 'Other basic assistance', 'Advice/information', and 'Advocacy/liaison on behalf of client'.
Source: Specialist homelessness services 2014–15, National supplementary table YOUNG.3 (702KB XLS).
Housing outcomes
For young people presenting alone who had closed support periods:
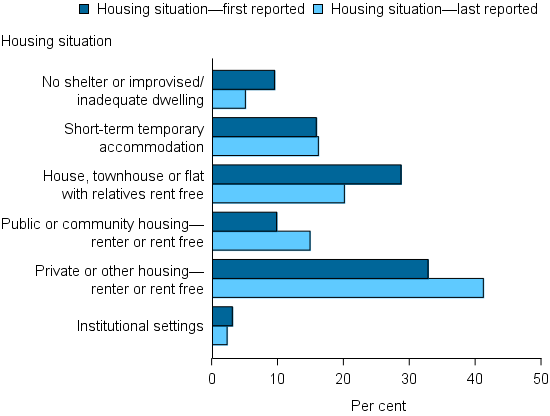
- The rate of homelessness declined from 54% at the beginning of support to 41% at the end of support (Figure YOUNG.2).
- The most common housing outcome for young people presenting alone was in private or other housing (as a renter, rent free or owner) (41%)—an increase from 33% at the beginning of support.
- At the beginning of support, 29% of young people who presented alone were 'couch surfing' or staying in housing with no tenure. This reduced to 20% by the end of support.
Figure YOUNG.2: Young people presenting alone who had closed support, by housing situation at beginning of support and end of support, 2014–15

Source: Specialist homelessness services 2014–15, National supplementary table YOUNG.4 (702KB XLS).
References
- Australian Bureau of Statistics (ABS) 2012. Census of population and housing: estimating homelessness, 2011. ABS cat. No. 2049.0. Canberra: ABS.
- Chamberlain & Johnson 2011. Pathways into adult homelessness. Journal of Sociology, 1–18 DOI: 10.1177/1440783311422458.


