How has the age profile changed over time?
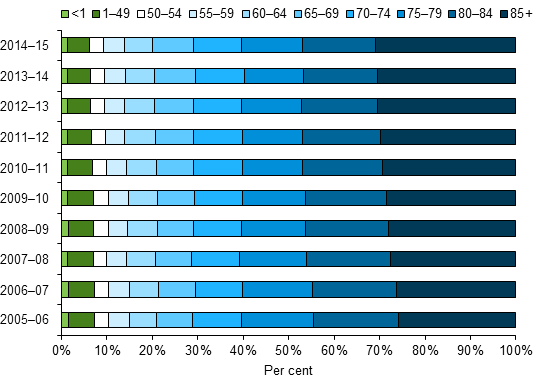
Since 2005–06, more than 93% of deaths in hospital were for patients aged 50 or over. Patients aged 85 years and over accounted for an increasing proportion of deaths in hospital—rising from 26% of deaths in hospital in 2005–06 (18,499) to 31% in 2014–15 (23,768) (Figure 5).
Figure 5: Proportion of deaths in hospital by age-group 2005–06 to 2014–15
Source: NHMD.