Who died in hospital?
Overall, there were more male deaths in hospital (55% or 41,853) than female deaths in hospital (45% or 34,999), resulting in a sex ratio of 119.6 male deaths in hospital for every 100.0 female deaths in hospital.
In 2014–15, the most common age group for deaths in hospital was 85 and over for both sexes (Figure 4). About 94% of deaths in hospital (72,057) were for patients aged 50 and over. About 1% of deaths in hospital were for infants under 1 (929).
The highest proportion of deaths that occurred in hospital (compared with deaths in other places) was for infants aged less than 1 year, for which about 92% (929 deaths) of the 1,012 total deaths occurred in hospital. For people aged 55 to 79 years, more than 60% (33,607 deaths) of the total 54,590 deaths occurred in hospital. People aged 20 to 24 years had the lowest proportion of deaths in hospital (20% or 139 deaths of the total of 690) [1].
Figure 4: Proportion of deaths in hospital by age-group and sex, 2014–15
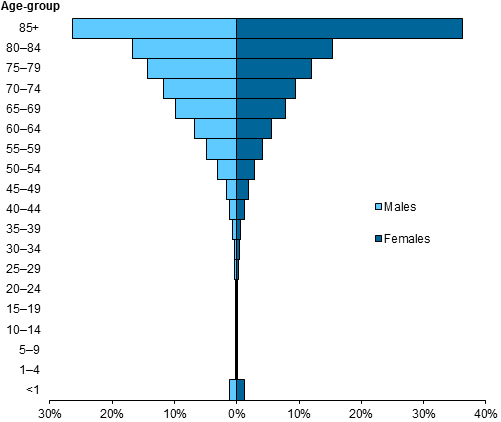
Source: NHMD.