Service events
Clinic-level service events
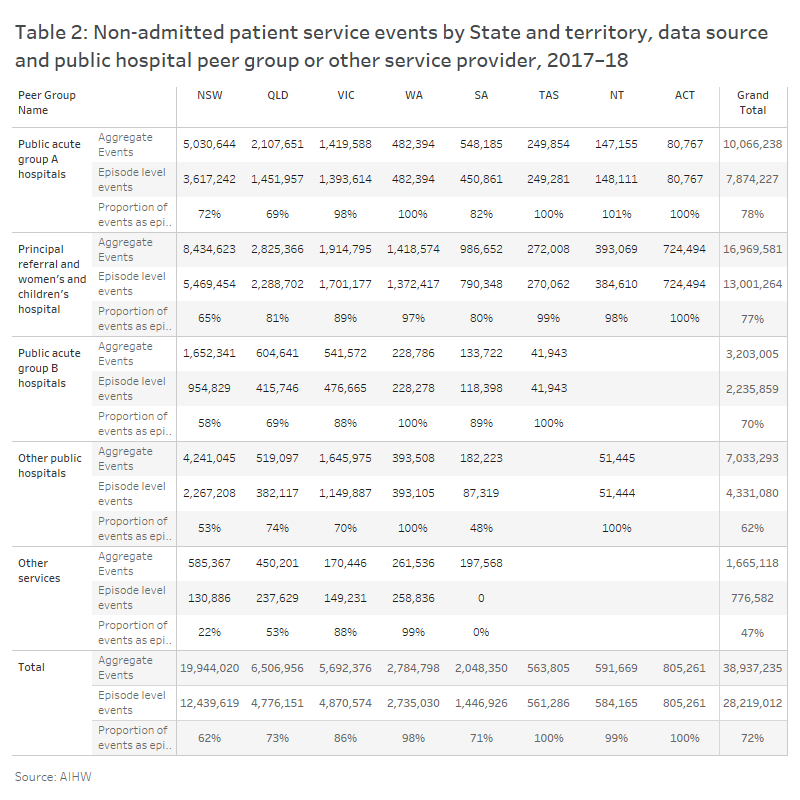
In 2017–18, 38.9 million non-admitted patient service events were reported at the clinic level to the NNAPC(agg)D by 601 public hospitals and 29 other services (including local hospital networks (LHNs) and private hospitals that provide public hospital services) (Table 2).
Principal referral and women’s and children’s hospitals provided 44% of non-admitted patient service events and Public acute group A hospitals accounted for a further 26%.
Other services accounted for another 1.7 million service events (4%).
Episode-level service events
In 2017–18, 28.2 million non-admitted patient service events were reported at the episode level to the NNAP(el)D by 511 public hospitals and 10 other services (Table 2). These accounted for 72% of total activity reported for the NNAPC(Agg)D.
Principal referral and women’s and children’s hospitals reported 46% of episode-level non‑admitted patient service events and Public acute group A hospitals accounted for a further 28%.
Data visualisation of table 2
See Table 2.1 for caveat information related to these data. Available to download from the Data section.
Where to go for more information
Information on the proportion of non-admitted patient service events reported at the episode-level by state and territory is in tables S2.1 and S2.2. Available for download in the data section of this report.
Additional information on non-admitted patient service events by Tier 2 clinic classes and by state and territory is available in Non-admitted patient clinics.
Information on data limitations and methods is available in Appendix A and Appendix B.