Use of illicit drugs
Background
Illicit drugs include a wide range of substances. Some of these drugs are more commonly used than others, and some can be obtained legally while others can only be obtained illegally.
However, there are some commonalities across most illicit drugs. They can lead to social harms, such as contact with the criminal justice system, health harms from intoxication and overdose, regular use and addiction, and economic harms. As such, it is important to regularly monitor the use of illicit substances in Australia, and populations that may at particular risk from some illicit drugs.
Illicit drugs in the National Drug Strategy Household Survey
In this report, illicit drugs include any drug which is illegal to possess or use, as well as any legal drug used in an illegal manner, for example:
- A pharmaceutical drug used for non‑medical purposes; or
- Glue or petrol that is sold legally, but is used in a manner that is not intended, such as inhaling fumes.
Non‑medical use refers to using the drug for recreational purposes (to induce or enhance a drug experience) and using a drug in a way that it was not prescribed/recommended (for example, using it to enhance a drug experience, for weight loss or performance enhancement).
Use of cocaine in Australia remains high
Use of many illicit drugs in Australia remained stable between 2019 and 2022–2023. This includes marijuana/cannabis (used by 11.5% of the population in 2022–2023), inhalants (1.4%), GHB, GBL and 1,4-BD (0.2%) and heroin (0.1%), as well as non‑medical use of tranquillisers and sleeping pills (1.6%) and steroids (0.2%). It was also true for cocaine, with 4.5% of people reporting having used cocaine in the previous 12 months, equating to around 1.0 million people.
In a global context, the prevalence of cocaine use was much higher in Australia than other countries in 2019. Data from the Organisation for Economic Cooperation and Development (OECD 2023) showed that 2019 estimates for cocaine use in Australia were among the highest of all available countries. With trends in recent use remaining stable between 2019 and 2022–2023 and lifetime use continuing to increase (Figure 16), this is likely to remain the case.
Figure 16: Use of cocaine in Australia, people aged 14 and over, 2001 to 2022–2023
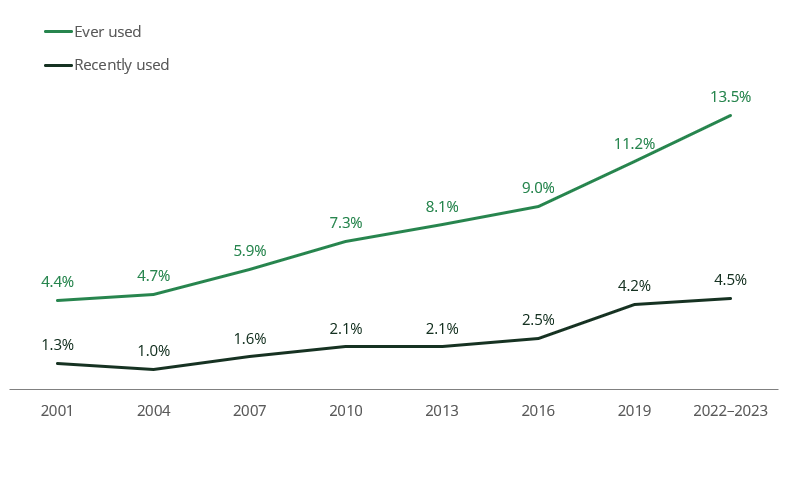
Source: NDSHS 2022–2023, Tables 5.2 and 5.6.
While recent use of cocaine remained stable among males, there was a rise among females from 3.0% in 2019 to 3.7% in 2022–2023. This reflects a general trend of increasing licit and illicit drug use among females, particularly among young females.
Rise in use of hallucinogens and ketamine
There were large increases in the use of two illicit drugs between 2019 and 2022–2023. The use of hallucinogens increased substantially, with 500,000 people having used them in the previous 12 months in 2022–2023, up from 300,000 in 2019. This was largely driven by the proportion of people who had used psilocybin/mushrooms doubling between 2019 and 2022–2023, but the proportion of people who had used LSD/acid/tabs also increased (Figure 17).
Figure 17: Recent(a) use of hallucinogen forms, people aged 14 and over, 2019 and 2022–2023
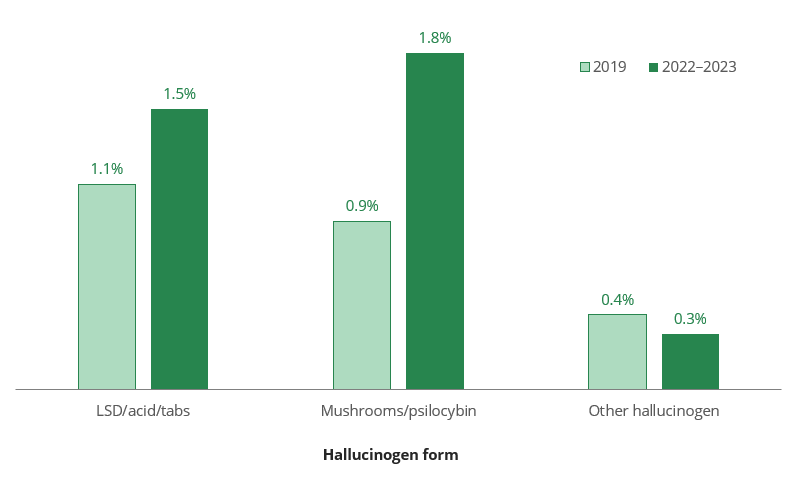
(a) Used at least once in the previous 12 months.
Source: NDSHS 2022–2023, Table 5.99.
Use of ketamine increased from 0.9% in 2019 to 1.4% in 2022–2023, meaning that around 300,000 people had used it in the previous 12 months. While ketamine was most likely to be used by people in their 20s (with 4.2% of people aged 20–29 having done so in the previous 12 months), there was a large increase in the proportion of people in their 30s using ketamine between 2019 (*0.5%) and 2022–2023 (2.5%).
* Estimate has a relative standard error between 25% and 50% and should be interpreted with caution.
Non‑medical use of opioids decreased
The proportion of people who had recently used some illicit drugs dropped between 2019 and 2022–2023. The largest fall was the use of ecstasy, although this is likely to be temporary. Early evidence shows that use is already increasing again.
Non‑medical use of pain-relievers and opioids declined substantially between 2019 (2.7% of the population) and 2022–2023 (2.2% of the population), with decreases in the non‑medical use of codeine, oxycodone, and tramadol at the national level.
Other drug categories with low prevalence in 2019, also showed positive signs of decreasing between 2019 and 2022–2023 (Figure 18). Only around 20,000 people had used synthetic cannabinoids in the previous 12 months in 2022–2023, and fewer than 10,000 had used new and emerging psychoactive substances or had used methadone/buprenorphine for non‑medical purposes.
Figure 18: Recent(a) use of selected illicit drugs, people aged 14 and over, 2016 to 2022–2023
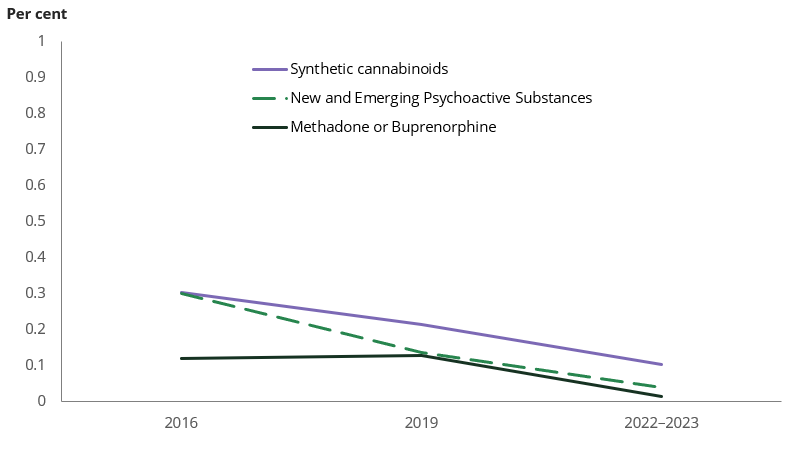
(a) Used at least once in the previous 12 months.
Source: NDSHS 2022–2023, Table 5.6.
Non‑medical use of pharmaceutical stimulants in Australia is common
For the first time in 2022–2023, the National Drug Strategy Household Survey asked respondents specifically about their use of pharmaceutical stimulants for non‑medical purposes. This includes drugs such as methylphenidate (for example, Ritalin, Concerta) and lisdexamfetamine (for example, Vyvanse).
The number of people who reported having used pharmaceutical stimulants for non‑medical purposes was similar to other illegal drugs:
- Around 1.2 million people reported having done so at some point in their lifetime, the same as the number of people who reported using inhalants in the previous 12 months.
- Close to 400,000 people reported using pharmaceutical stimulants for non‑medical purposes in the previous 12 months, similar to the number who had used ecstasy in 2022–2023.
Figure 19: Use of pharmaceutical stimulants for non‑medical purposes, by selected social characteristics, people aged 14 and over, 2022–2023
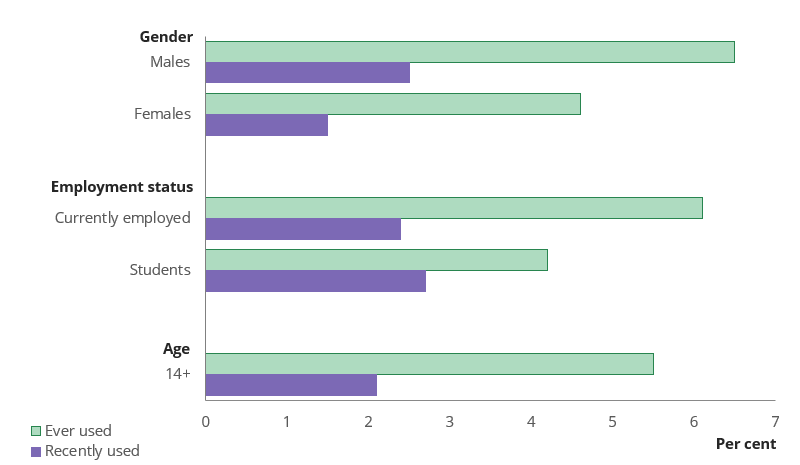
Source: NDSHS 2022–2023, Tables 6.17, 6.19 and 6.21.
Students were also slightly more likely to have recently used pharmaceutical stimulants for non‑medical purposes than people who were currently employed (Figure 19), a difference to most other illicit drugs which were more likely to have been used by those who were employed.