Module 2: Patient experience of health care
Cultural safety is defined with reference to the experience of Aboriginal and Torres Strait Islander people who access and use health care services, including their treatment by health care professionals and their feelings of cultural safety. It also includes some indirect measures of cultural safety where clients take their own leave from hospitals. These measures suggest that there are situations where Indigenous patients do not find the hospital environment to be culturally safe.
What data are available?
New data were available to update 9 out of 23 measures reported in Module 2 for the 2023 release. The other 14 measures could not be updated due to discontinued surveys and data items, or frequency of data collection. This information has been provided throughout this module. Additional information is available in Data sources and data gaps and Technical notes.
The data sources include the ABS national Aboriginal and Torres Strait Islander health and social surveys, surveys of public hospital patients in New South Wales and Queensland and Reconciliation Australia’s Australian Reconciliation Barometer survey. There are also data from the national hospital data collections on indirect measures of cultural safety.
For further information on the data sources used in this module, see Module 2 – Data sources and data gaps.
Key findings
The National Aboriginal and Torres Strait Islander Health Survey shows that in 2018–19:
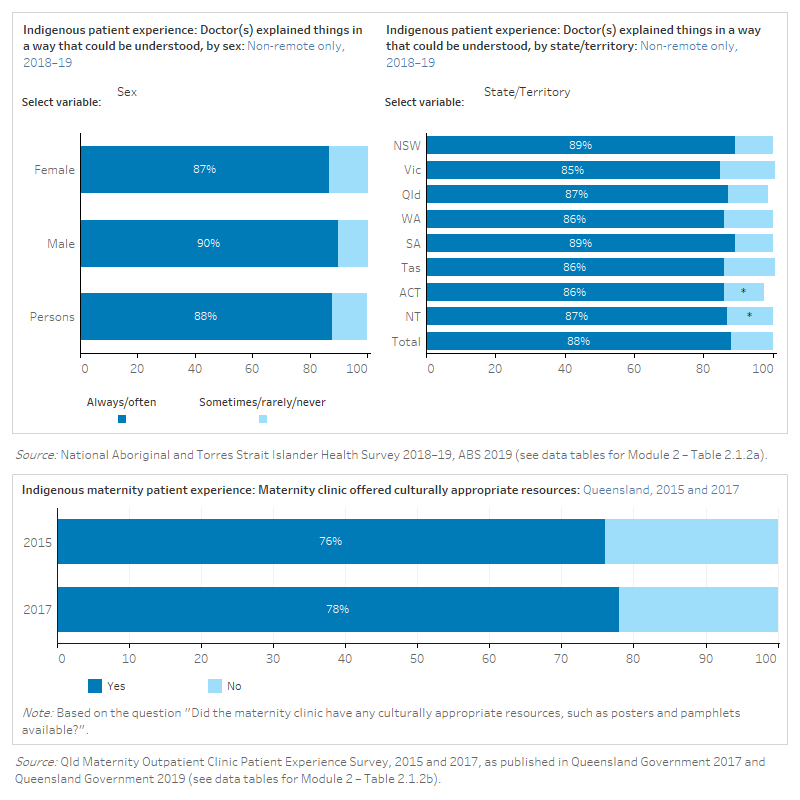
- 88% of Indigenous Australians aged 15 and over in non-remote areas reported that doctors always/often explained things in a way that could be understood.
- 91% of Indigenous Australians aged 15 and over in non-remote areas reported that doctors always/often showed respect for what was said.
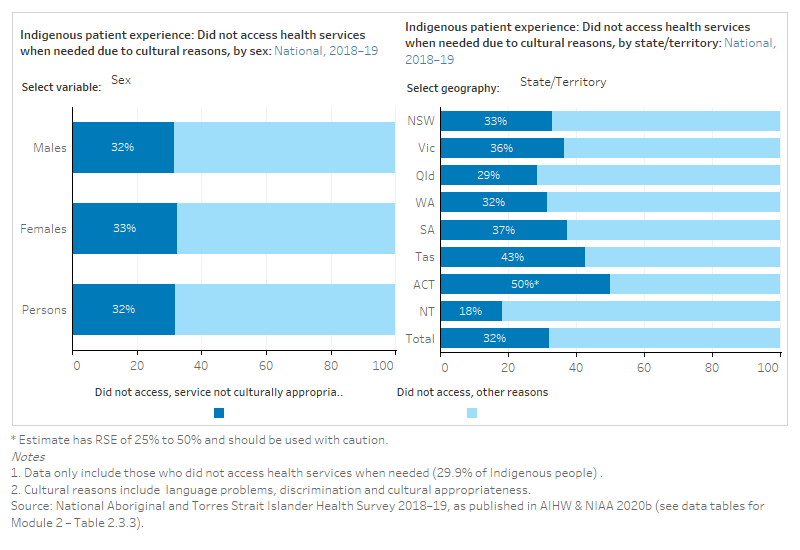
- 32% of Indigenous Australians who did not access health services when they needed to, indicated this was due to cultural reasons, such as language problems, discrimination and cultural appropriateness.
- The Australian Reconciliation Barometer showed that the proportion of Indigenous Australians reporting racial discrimination by doctors, nurses and/or medical staff in the last 12 months has increased since 2014 (11% in 2014 to 20% in 2022).
The differences in rates of Indigenous and non-Indigenous hospital patients who choose to leave prior to commencing or completing treatment are frequently used as indirect measures of cultural safety.
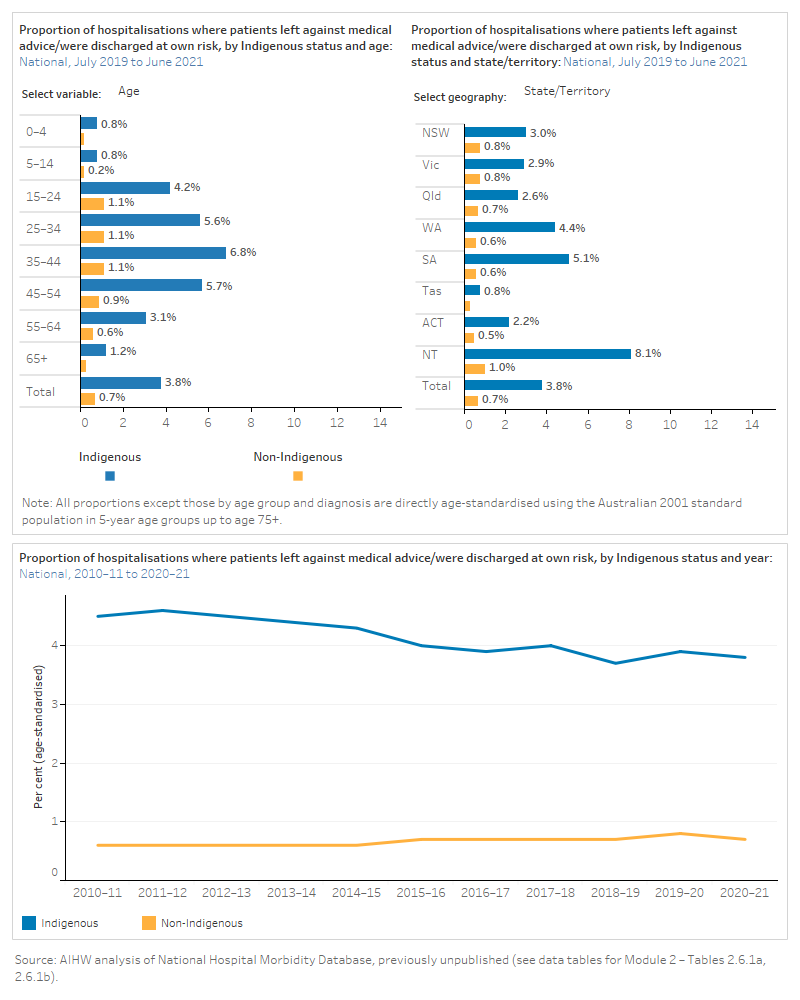
- Indigenous Australians left against medical advice for 4.0% (26,985) of admitted-patient hospitalisations from 2019–20 to 2020–21. Age-standardised, this was over 5 times the proportion of non-Indigenous Australians (3.8% and 0.7%, respectively).
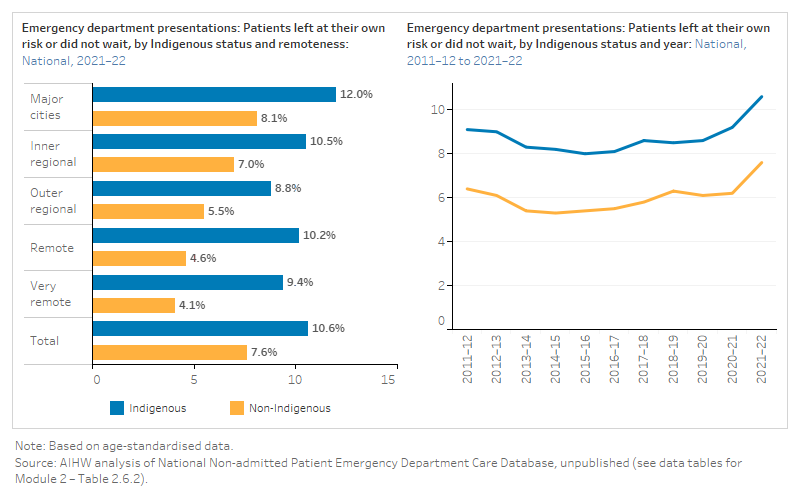
- In 2021–22, Indigenous Australians left at own risk or did not wait in 75,267 emergency department attendances. Age-standardised, this was 1.4 times the proportion of incomplete emergency attendances for non-Indigenous Australians (10.6% and 7.6%, respectively).
See Module 2 data tables for all data presented in this module.
Data gaps and limitations
Data from Indigenous health care users about the health care that they receive are limited. Data from surveys of hospital patients in all states and territories are required, as well as additional national data on patient satisfaction with different types of health care services. However, data from these surveys are not always available by Indigenous status and may not include questions that relate to cultural safety for Indigenous Australians.
Module 2 domains:
The quality of communication between health care providers and Aboriginal and Torres Strait Islander patients, including an awareness and interest in Indigenous culture, is important for ensuring patients feel culturally safe. Respectful communication makes it more likely that Indigenous Australians will access health care, and that the care they receive will be more effective. The data reported on Indigenous patient experiences of communication with health care providers come from national surveys, and public hospital patient surveys in some states.
Interaction with health professionals
The data items below are from the NATSIHS, the NATSISS and the NSW Admitted Patient Survey. The ABS collects data for the NATSIHS every 5–6 years and the most recent available data is for the 2018–19 collection period. The NATSISS has been discontinued; the most recent collection period for these data was 2014–15. Some data items collected through NSW Admitted Patient Survey have been discontinued at different times; the most recent available data has been used in this report. For a complete list of what data were available for the 2023 update, see Technical notes.
The figure is a set of interactive graphs showing the proportion of Indigenous people who thought doctors listened carefully to them, by age group, sex, remoteness, state and territory and over time. It then shows the proportion of hospital patients in New South Wales who had the opportunity to talk to a doctor or nurse when needed, by Indigenous status over time. Finally, it shows the proportion of Indigenous hospital patients in New South Wales who received support or the offer of support from an Aboriginal Health Worker. See data tables for Module 2 – Tables 2.1.1a, 2.1.1b, 2.1.1c and 2.1.1d.
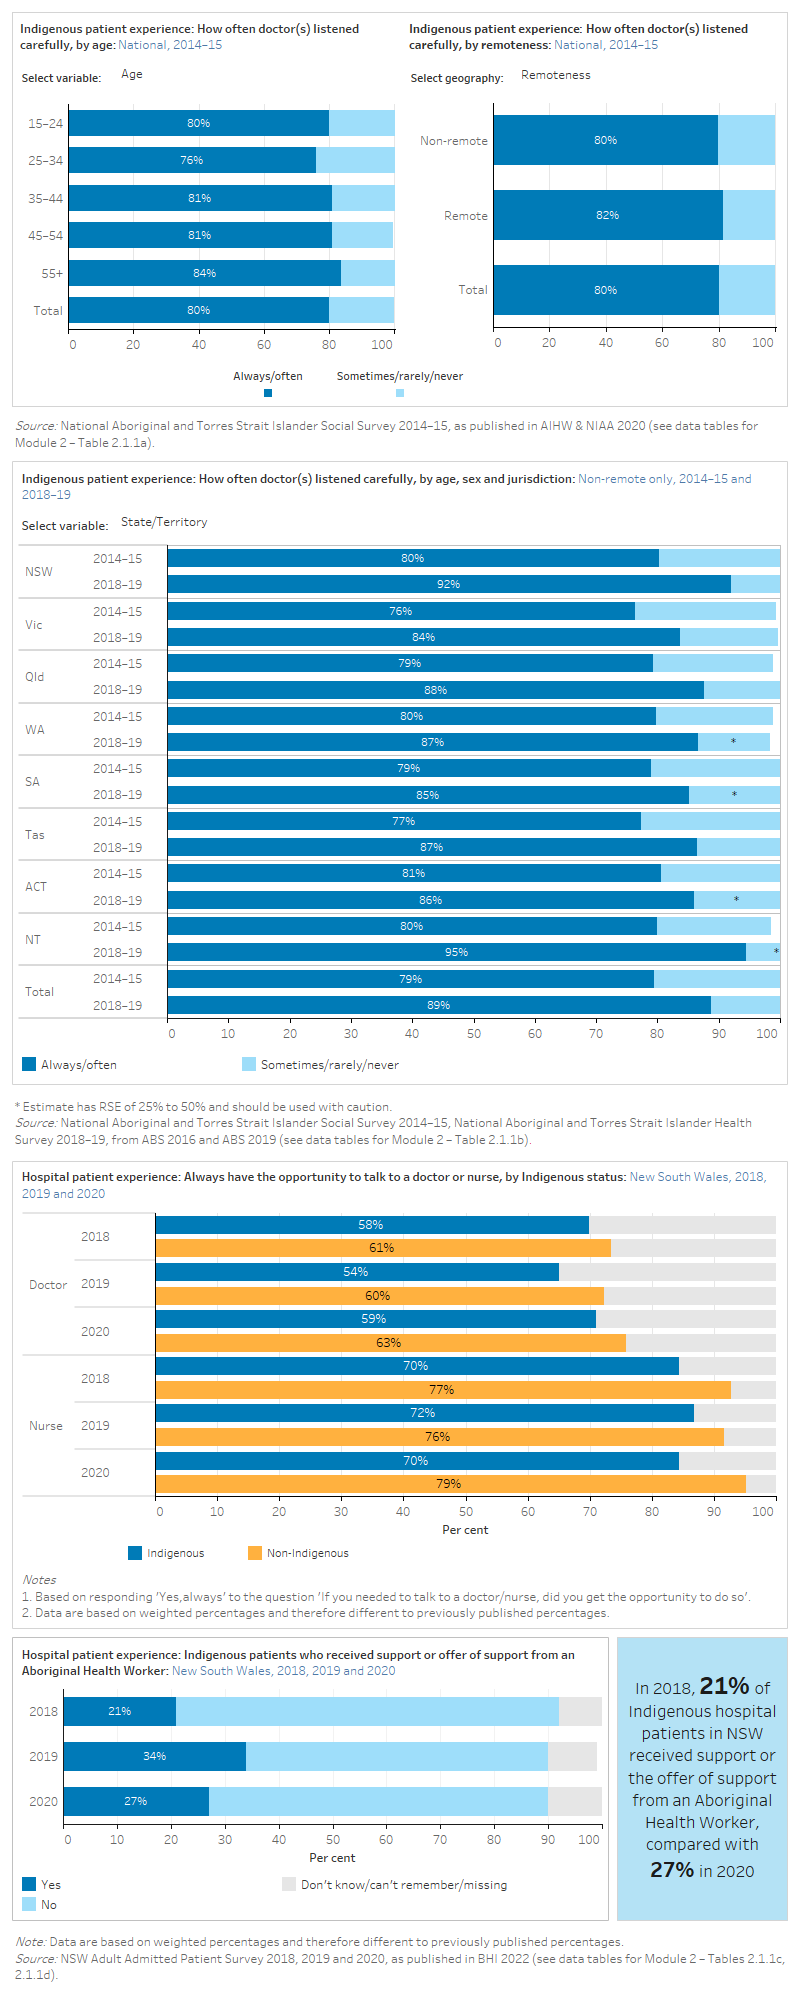
Results from the NSW 2019 Adult Admitted Patient Survey (AAPS) showed that the majority of Aboriginal and Torres Strait Islander patients said health professionals ‘always’ explained things in an understandable way (73%), although this result was lower than for non-Indigenous patients (81%) (BHI 2021).
The NSW 2019 AAPS also described aspects of care that were most strongly associated with Aboriginal and Torres Strait Islander people reporting that the overall care they received in hospital was ‘very good’. These factors included that their care was ‘very well’ organised and that they were treated fairly based their Aboriginality or other reasons (BHI 2021).
Results from the NSW 2019 Maternity Care Survey showed that 79% of Aboriginal and Torres Strait Islander women who had the support of an Aboriginal Health Worker rated their overall care during labour and birth as ‘very good’, significantly higher than those who were not supported by an Aboriginal Health Worker, 58%, after adjusting for age (BHI 2021).
Information provided in a way that could be understood
The data items below are sourced from the NATSIHS and the Qld Maternity Outpatient Clinic Patient Experience survey. The ABS collects data for the NATSIHS every 5–6 years and the most recent available data is for the 2018–19 collection period. The Qld Maternity Outpatient Clinic Patient Experience Survey has been discontinued. The most recent collection period for these data was 2017. For a complete list of what data were available for the 2023 update, see Technical notes.
The figure is a set of interactive graphs showing the proportion of Indigenous people who felt that doctors explained things in a way that could be understood, by sex, age group, state and territory and service type. It also shows Indigenous maternity patients in Queensland that had their maternity clinic offer culturally appropriate resources, in 2015 and 2017. See data tables for Module 2 – Tables 2.1.2a and 2.1.2b.
Quality of relationship
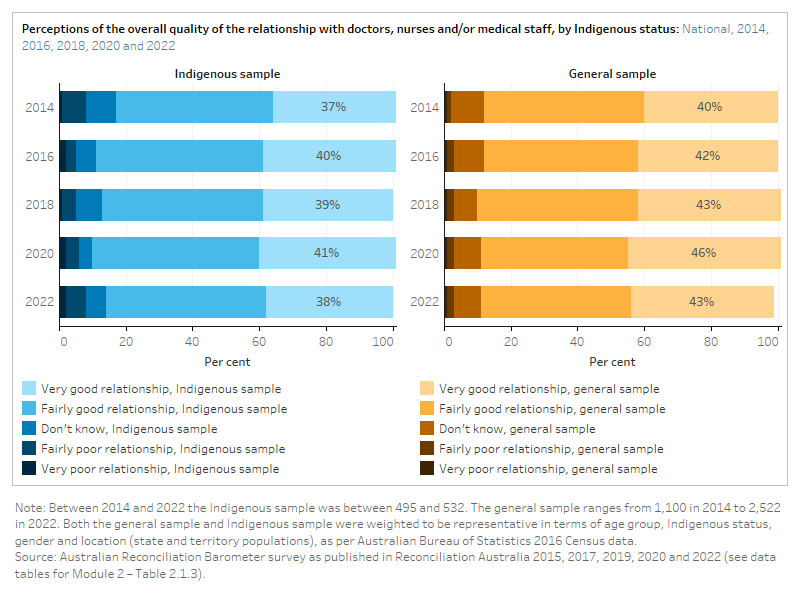
The figure is a set of interactive graphs showing perceptions of the overall quality of the relationship with doctors, nurses and/or medical staff among an Indigenous sample and a total sample of Australians. See data tables for Module 2 – Table 2.1.3.
References
ABS (Australian Bureau of Statistics) 2016. National Aboriginal and Torres Strait Islander Social Survey. [TableBuilder]. Retrieved 9 November, 2020.
ABS 2019. National Aboriginal and Torres Strait Islander Health Survey 2018–19. [TableBuilder]. Retrieved 9 November, 2020.
AIHW & NIAA (Australian Institute of Health and Welfare & National Indigenous Australians Agency 2020. Aboriginal and Torres Strait Islander Health Performance Framework (HPF) report 2017 [archived]. Canberra: AIHW.
BHI (Bureau of Health Information) 2021. The Insights Series-Aboriginal people’s experiences of hospital care. July 2021. Sydney (NSW): BHI.
BHI 2022. Adult admitted patient survey. Sydney (NSW): BHI. Retrieved 4 March, 2023.
Queensland Government 2017. 2015 Maternity Outpatient Clinic Patient Experience Statewide Report. Queensland: Queensland Health.
Queensland Government 2019. 2017 Maternity Outpatient Clinic Patient Experience Survey Report. Queensland: Queensland Health.
Reconciliation Australia 2015. 2014 Australian Reconciliation Barometer. Polity Research & Consulting.
Reconciliation Australia 2017. 2016 Australian Reconciliation Barometer. Polity Research & Consulting.
Reconciliation Australia 2019. 2018 Australian Reconciliation Barometer. Polity Research & Consulting.
Reconciliation Australia 2020. 2020 Australian Reconciliation Barometer. Polity Research & Consulting.
Reconciliation Australia 2022. 2022 Australian Reconciliation Barometer. Polity Research & Consulting.
Aboriginal and Torres Strait Islander peoples are more likely to feel culturally safe when they are treated with understanding, respect and empathy by health care providers. This leads to more trust and confidence in the health care they receive. The data reported on Indigenous patient experiences of interpersonal treatment come from national surveys, and public hospital patient surveys in some states.
Respect
The data items below are sourced from the NATSIHS and the NATSISS. The ABS collects data for the NATSIHS every 5–6 years and the most recent available data is for the 2018–19 collection period. The NATSISS has been discontinued; the most recent collection period for these data was 2014–15. For a complete list of what data were available for the 2023 update, see Technical notes.
The figure is a set of interactive graphs showing the proportion of Indigenous people who felt doctors showed respect for what they said, by age group, sex, remoteness, state and territory and over time. See data tables for Module 2 – Tables 2.2.1a and 2.2.1b.
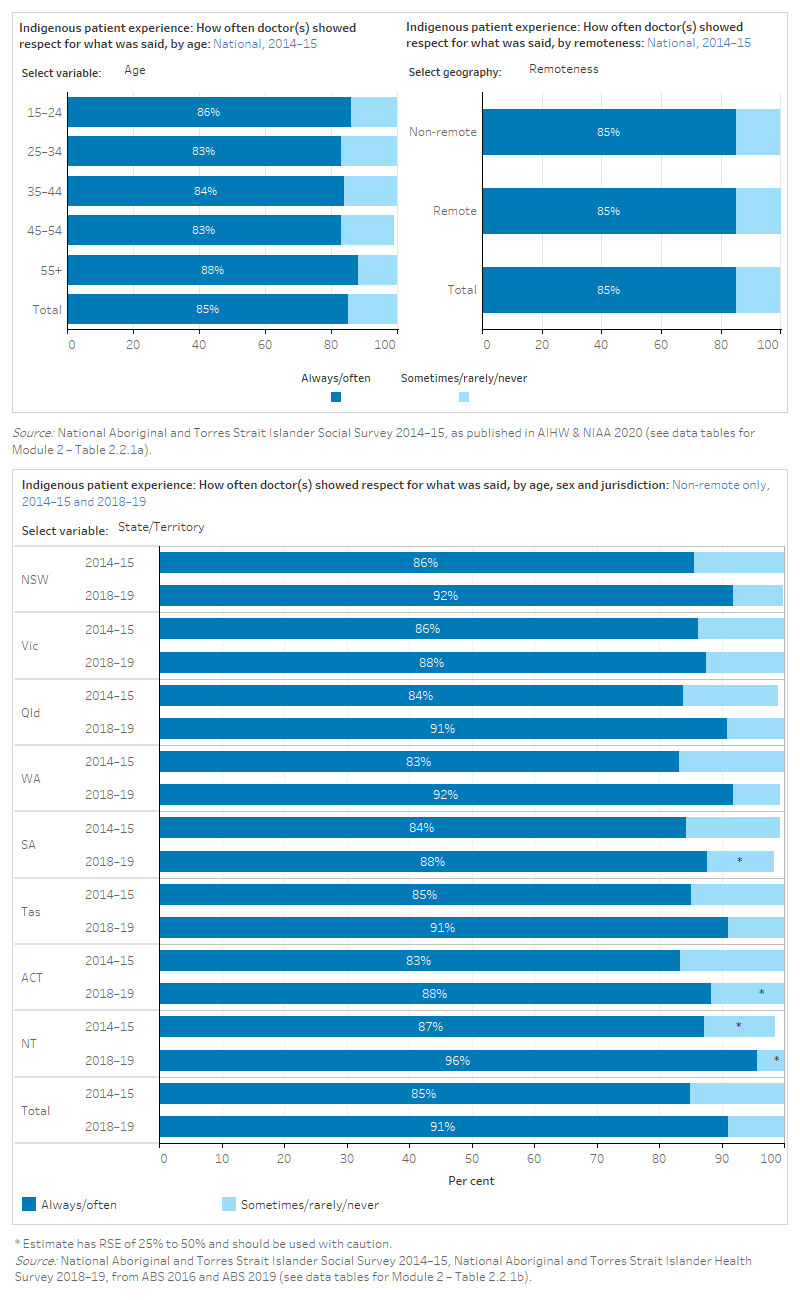
Results from the 2014–15 NATSISS and 2018–19 NATSIHS showed that the proportion of Indigenous Australians reporting that doctors always/often showed respect for what was said increased for all states and territories (ABS 2016, 2019). However, data from the Australian Reconciliation Barometer showed that trust in doctors, nurses and/or medical staff remained steady from 2014 to 2022 (Reconciliation Australia 2015, 2017, 2019, 2020, 2022).
NSW 2019 Adult Admitted Patient Survey showed that around 78% of Aboriginal and Torres Strait Islander patients said they were treated with respect and dignity. However, this was substantially lower than the percentage of non-Indigenous patients who reported this in answer to the same questions (86%) (BHI 2021).
Trust and confidence
The data items below are sourced from the NATSISS and the Australian Reconciliation Barometer (ARB). The NATSISS has been discontinued and the most recent available data is for the 2014–15 collection period. The ARB collects data every 2 years and the most recent data is for the 2022 collection period. For a complete list of what data were available for the 2023 update, see Technical notes.
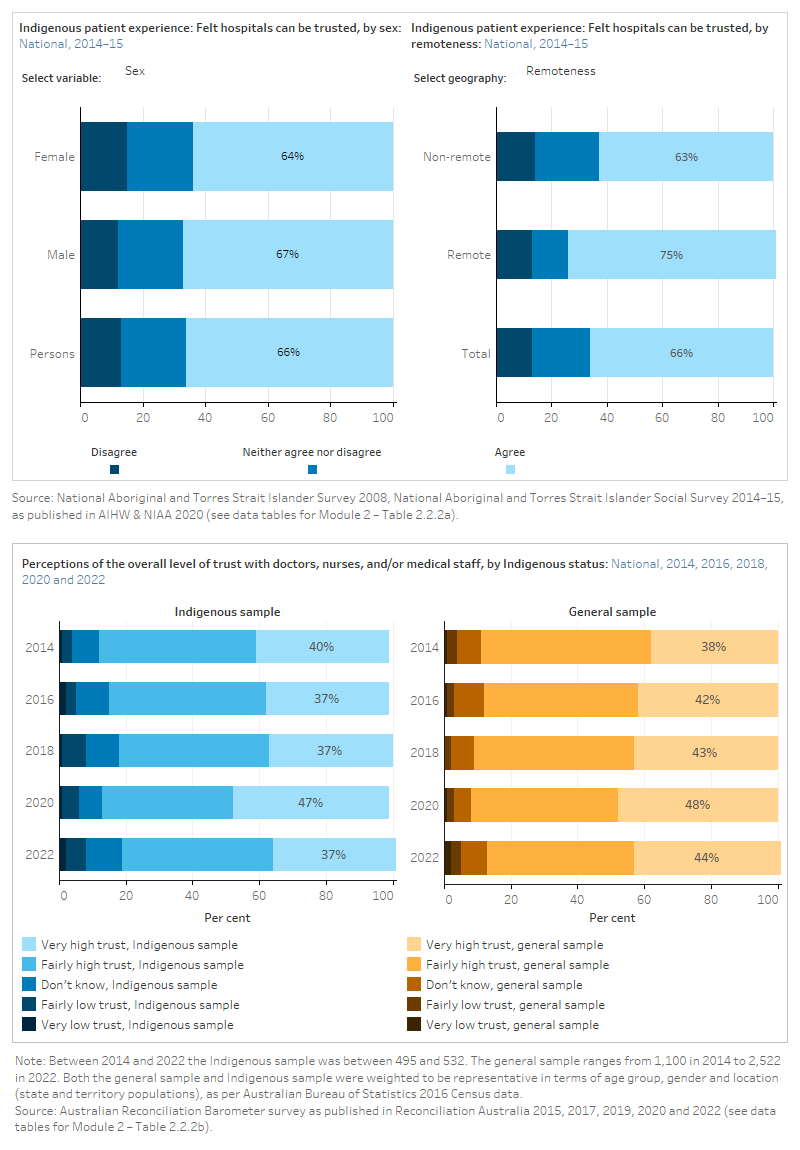
The figure is a set of interactive graphs showing the proportion of Indigenous people who felt that hospitals can be trusted, by age group, sex, remoteness, state and territory and over time. It also shows perceptions of the overall level of trust with doctors, nurses and/or medical staff among an Indigenous sample and a total sample of Australians. See data tables for Module 2 – Tables 2.2.2a and 2.2.2b.
Staff were polite and welcoming
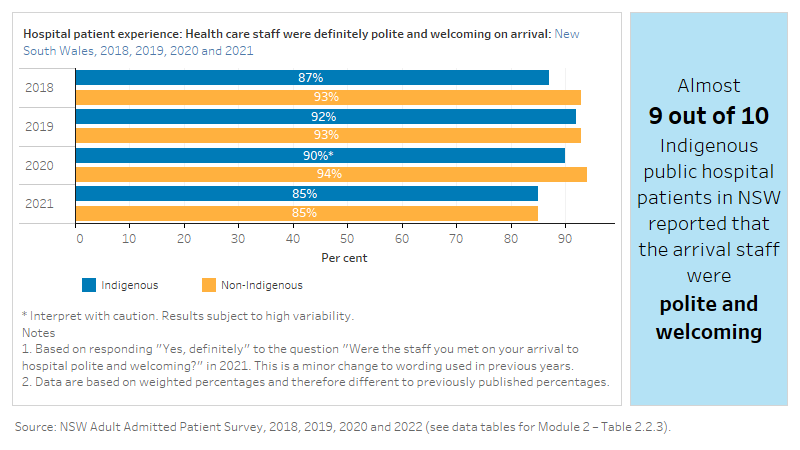
The figure is a set of interactive graphs showing the proportion of hospital patients in New South Wales who felt that health care staff were polite and welcoming on their arrival, by Indigenous status and over time. See data tables for Module 2 – Table 2.2.3.
Respect for cultural or religious beliefs
The data items below are sourced from the NSW Admitted Patient Survey and the Qld Maternity Outpatient Clinic Patient Experience Survey. Some data items collected through NSW Admitted Patient Survey have been discontinued at different times. The most recent available data has been used in this report. The Qld Maternity Outpatient Clinic Patient Experience Survey has been discontinued. For a complete list of what data were available for the 2023 update, see Technical notes.
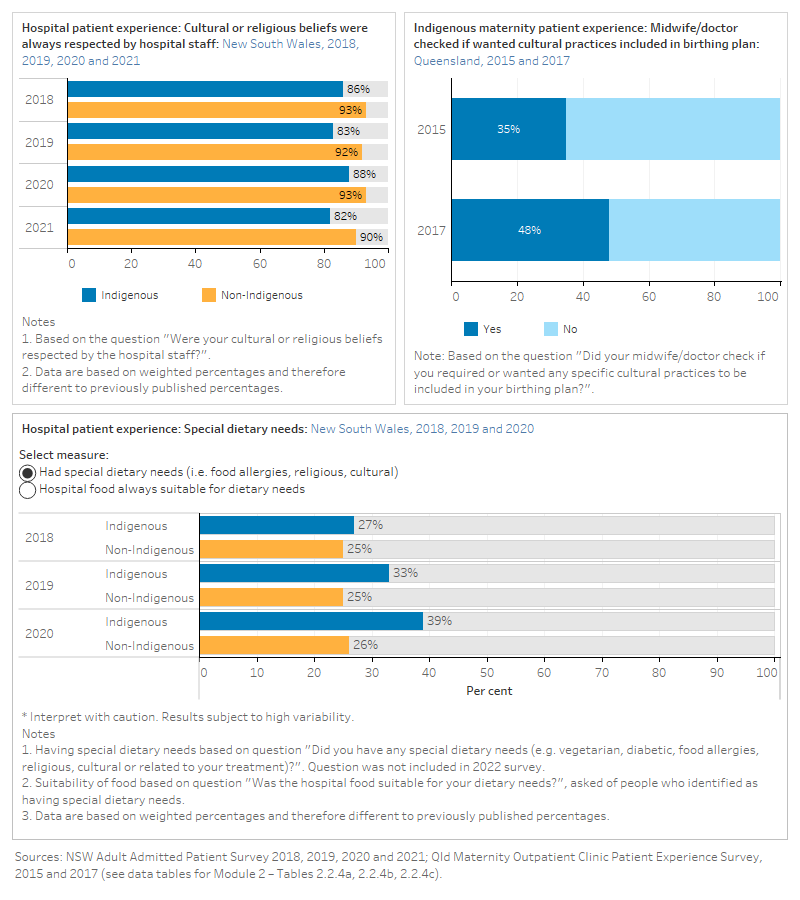
The figure is a set of interactive graphs showing the proportion of hospital patients in New South Wales who self that their cultural or religious beliefs were always respected by hospital staff, and whether hospital food was suitable for dietary needs, by Indigenous status and over time. It also shows the proportion of Indigenous maternity patients in Queensland whose midwife/doctor checked if they wanted cultural practices included in the birthing plan over time. See data tables for Module 2 – Tables 2.2.4a, 2.2.4b and 2.2.4c.
References
ABS (Australian Bureau of Statistics) 2016. National Aboriginal and Torres Strait Islander Social Survey. [TableBuilder]. Retrieved 11 November, 2020.
ABS 2019. National Aboriginal and Torres Strait Islander Health Survey 2018–19. [TableBuilder]. Retrieved 11 November, 2020.
AIHW & NIAA (Australian Institute of Health and Welfare & National Indigenous Australians Agency) 2020. Aboriginal and Torres Strait Islander Health Performance Framework (HPF) report 2017 [archived]. Canberra: AIHW.
BHI (Bureau of Health Information) 2021. The Insights Series-Aboriginal people’s experiences of hospital care. July 2021. Sydney (NSW): BHI.
BHI 2022. Adult admitted patient survey. Sydney (NSW): BHI. Retrieved 23 February 2023.
Queensland Government 2017. 2015 Maternity Outpatient Clinic Patient Experience Statewide Report. Queensland: Queensland Health.
Queensland Government 2019. 2017 Maternity Outpatient Clinic Patient Experience Survey Report. Queensland: Queensland Health.
Reconciliation Australia 2015. 2014 Australian Reconciliation Barometer. Polity Research & Consulting.
Reconciliation Australia 2017. 2016 Australian Reconciliation Barometer. Polity Research & Consulting.
Reconciliation Australia 2019. 2018 Australian Reconciliation Barometer. Polity Research & Consulting.
Reconciliation Australia 2020. 2020 Australian Reconciliation Barometer. Polity Research & Consulting.
Reconciliation Australia 2022. 2022 Australian Reconciliation Barometer. Polity Research & Consulting.
Where Aboriginal and Torres Strait Islander peoples are treated badly, unfairly or unequally because of their race, culture or language they may be less likely to access health care, or to feel comfortable and culturally safe when receiving care. The data reported on Indigenous patient experiences of interpersonal treatment come from national surveys.
Analysis using data from the Mayi Kuwayu longitudinal study described the effects of discrimination towards Aboriginal and Torres Strait Islander people, across demographic characteristics, and how discrimination related to health and social and emotional wellbeing outcomes (Thurber at al. 2021).
Unfair treatment and discrimination
The data items below are sourced from the AATSIHS and the Australian Reconciliation Barometer (ARB). The AATSIHS has been discontinued and the most recent available data is for the 2012–13 collection period. The ARB collects data every 2 years and the most recent data is for the 2022 collection period. For a complete list of what data were available for the 2023 update, see Technical notes.
The figure is a set of interactive graphs showing the proportion of Indigenous people who were treated unfairly by healthcare staff at hospitals/doctors’ surgeries, by sex, and remoteness. It also shows whether a person or their family has been racially discriminated against by doctors, nurses and/or medical staff among an Indigenous sample and a total sample of Australians. See data tables for Module 2 – Tables 2.3.1a and 2.3.1b.
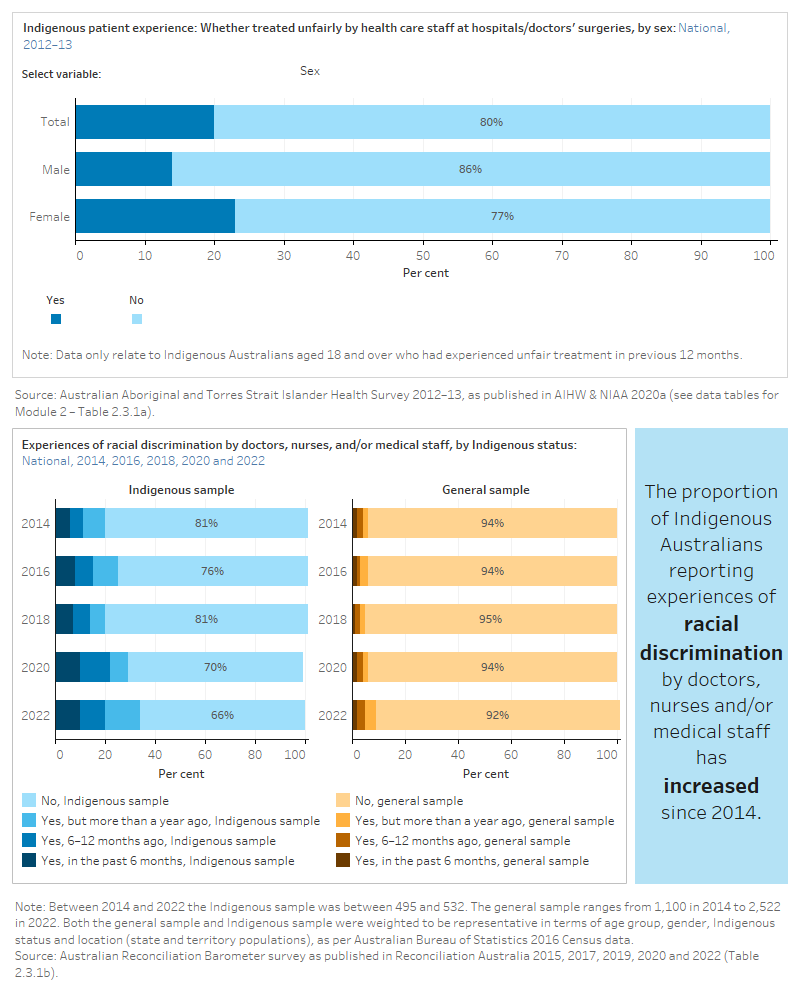
Results from the NSW 2019 Adult Admitted Patient Survey showed that most Aboriginal and Torres Strait Islander patients reported they were not treated unfairly (89%). However, this was lower than the percentage of non-Indigenous patients (95%) (BHI 2021). The Australian Reconciliation Barometer showed that the proportion of Indigenous Australians reporting racial discrimination by doctors, nurses and/or medical staff in the last 12 months has increased since 2014 (11% in 2014 to 20% in 2022) (Reconciliation Australia 2015, 2022).
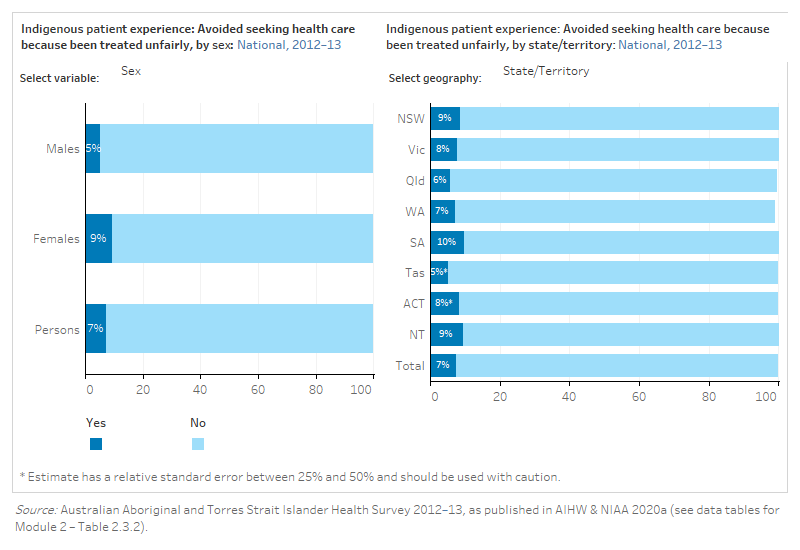
Avoided health care due to poor treatment
The data items below are sourced from the AATSIHS. The AATSIHS was discontinued after the 2012–13 collection period. For a complete list of what data were available for the 2023 update, see Technical notes.
The figure is a set of interactive graphs showing the proportion of Indigenous people who avoided seeking healthcare because they had been treated unfairly, by age group, sex, state and territory and remoteness. See data tables for Module 2 – Tables 2.3.2.
Did not access health care due to cultural reasons
The data items below are sourced from the NATSIHS. The ABS collects data for the NATSIHS every 5–6 years and the most recent available data is for the 2018–19 collection period. For a complete list of what data were available for the 2023 update, see Technical notes.
The figure is a set of interactive graphs showing the proportion of Indigenous people who did not access health care due to cultural reasons, by age group, sex, state and territory and remoteness. See data tables for Module 2 – Tables 2.3.3.
References
AIHW & NIAA (Australian Institute of Health and Welfare & National Indigenous Australians Agency) 2020a. Aboriginal and Torres Strait Islander Health Performance Framework (HPF) report 2017 [archived]. Canberra: AIHW.
AIHW & NIAA 2020b. Aboriginal and Torres Strait Islander Health Performance Framework. Canberra: AIHW.
BHI (Bureau of Health Information) 2021. The Insights Series-Aboriginal people’s experiences of hospital care. July 2021. Sydney (NSW): BHI.
Reconciliation Australia 2015. 2014 Australian Reconciliation Barometer. Polity Research & Consulting.
Reconciliation Australia 2017. 2016 Australian Reconciliation Barometer. Polity Research & Consulting.
Reconciliation Australia 2019. 2018 Australian Reconciliation Barometer. Polity Research & Consulting.
Reconciliation Australia 2020. 2020 Australian Reconciliation Barometer. Polity Research & Consulting.
Reconciliation Australia 2022. 2022 Australian Reconciliation Barometer. Polity Research & Consulting.
Thurber KA, Colonna E, Jones R, Gee GC, Priest N, Cohen R, Williams DR, Thandrayen J, Calma T, Lovett R, et al. 2021. ‘Prevalence of Everyday Discrimination and Relation with Wellbeing among Aboriginal and Torres Strait Islander Adults in Australia’. International Journal of Environmental Research and Public Health. 18(12):6577. doi:10.3390/ijerph18126577.
Empowerment is related to the extent to which people feel included in decisions about their health care, and that they have some control over the care that they receive. Being provided with information about the rights of health care consumers also empowers patients. The data reported on empowerment come from New South Wales public hospital patient experience surveys.
Involved in health care decisions
The figure is a set of interactive graphs showing the proportion of hospital patients in New South Wales who were involved in decisions about their care or treatment, by Indigenous status over time. See data tables for Module 2 – Table 2.4.1.
Results from the NSW 2019 Maternity Care Survey showed that 73% of Aboriginal and Torres Strait Islander women said their decisions about how they wanted to feed their baby were ‘always’ respected by health professionals. In contrast, when asked the same question, 82% of non-Indigenous women gave this response (BHI 2021).
Provided with information about patient rights
The data item below is sourced from the NSW Admitted Patient Survey and is no longer collected. The most recent available data is for the 2014 collection period. For a complete list of what data were available for the 2023 update, see Technical notes.
The figure is a set of interactive graphs showing the proportion of hospital patients in New South Wales received information about their rights as a patient, by Indigenous status. See data tables for Module 2 – Table 2.4.2.
References
BHI (Bureau of Health Information) 2016. Patient Perspectives: Hospital care for Aboriginal people. 10 August 2016. Sydney: BHI.
BHI 2021. The Insights Series-Aboriginal people’s experiences of hospital care. July 2021. Sydney (NSW): BHI.
BHI 2022. Healthcare Observer. Sydney (NSW): BHI. Retrieved 4 March, 2022.
Aboriginal and Torres Strait Islander patients are more likely to feel culturally safe when family members, or other people important to them, are included in the health care process and decisions about their care. This can help improve the quality of health care and ensure that it is more effective. The data reported on family inclusion come from New South Wales public hospital patient experience surveys.
Inclusion
The data items below are sourced from the NSW Admitted Patient Survey. Some data items collected through NSW Admitted Patient Survey have been discontinued. The most recent available data has been used in this report. For a complete list of what data were available for the 2023 update, see Technical notes.
The figure is a set of interactive graphs showing the proportion of hospital patients in New South Wales by whether the right amount of information was given to their family and whether their family got an opportunity to talk to a doctor, by Indigenous status. See data tables for Module 2 – Tables 2.5.1 and 2.5.2.
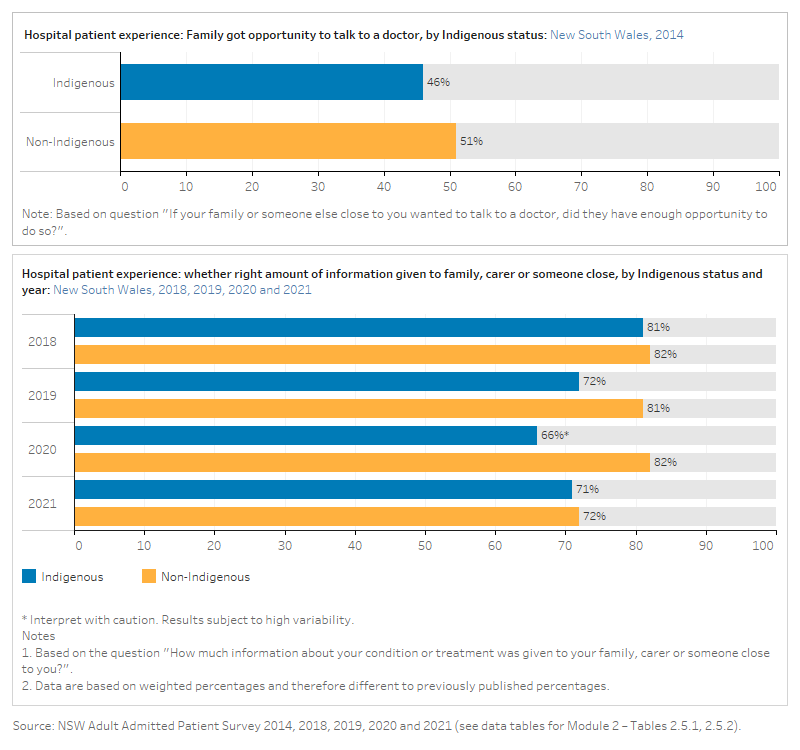
Results from the NSW 2019 Adult Admitted Patient Survey showed Aboriginal and Torres Strait Islander patients in rural hospitals were significantly more positive when asked how much information about their condition or treatment was given to their family or someone close to them (78% in rural hospitals said the ‘right amount’, compared with 69% in urban hospitals) (BHI 2021).
References
BHI (Bureau of Health Information) 2016. Patient Perspectives: Hospital care for Aboriginal people. 10 August 2016. Sydney: BHI.
BHI 2021. The Insights Series-Aboriginal people’s experiences of hospital care. July 2021. Sydney (NSW): BHI.
BHI 2022. Adult admitted patient survey. Sydney (NSW): BHI. Retrieved 23 February 2023.
Leave events refer to situations where hospital patients choose to leave prior to commencing or completing their treatment. Patient experiences of health care services affect health-related behaviours and health outcomes. Leave event patients are more likely to re-present to emergency departments and have higher mortality rates (Shaw 2016). There have been a limited number of studies on Aboriginal and Torres Strait Islander peoples’ reasons for leave events from hospital. However, common factors include institutionalised racism; a lack of cultural safety; a distrust of the health system; miscommunication; family and social obligations; isolation and loneliness; a lack of understanding of the treatment they were receiving and the feeling that the treatment had finished; and communication and language barriers between staff and the patient (Shaw 2016). For more information see Measure 3.09: Discharge against medical advice on the Aboriginal and Torres Strait Islander Health Performance Framework.
This domain includes two leave events measures: incomplete emergency attendances and discharge from hospital against medical advice. Leave events are more likely for Indigenous Australians – which may be due to feeling culturally unsafe – and this is therefore viewed as an indirect measure of cultural safety, or the extent to which hospitals are responsive to Indigenous Australian patients’ needs.
The data reported for these two measures come from hospitals administrative data.
Admitted patient leave events
The figure is a set of interactive graphs showing the proportion of hospitalisations where patients left against medical advice/were discharged at their own risk, by Indigenous status and age, sex, diagnosis, state and territory, remoteness and over time. See data tables for Module 2 – Tables 2.6.1a, 2.6.1b.
Emergency department leave events
The figure is a set of interactive graphs showing the proportion of emergency department presentations where patients left at their own risk or did not wait, by Indigenous status, remoteness and over time. See data tables for Module 2 – Table 2.6.2.
References
Shaw C 2016. An evidence-based approach to reducing discharge against medical advice amongst Aboriginal and Torres Strait Islander patients. Deakin, ACT: AHHA.
The data sources with relevant data items on patient experiences and with data available on Indigenous Australians were:
- ABS National Aboriginal and Torres Strait Islander Health Survey, 2018–19
- ABS National Aboriginal and Torres Strait Islander Social Survey, 2014–15
- ABS Australian Aboriginal and Torres Strait Islander Health Survey, 2012–13
- Australian Reconciliation Barometer, 2014, 2016, 2018, 2020, 2022
- National Hospitals Data Collection
- National Hospital Morbidity Database, 2019–20, 2020–21
- National Non-Admitted Patients Emergency Department Care Database, 2019–20, 2020–21, 2021–22
- New South Wales Adult Admitted Patient Survey, 2014, 2018, 2019, 2020, 2021
- Queensland Maternity Outpatient Clinic Patient Experience Survey, 2015, 2017.
| Domains and measures | AATSIHS/ NATSIHS /NATSISS | NHMD /NNAPEDCD | Australian Reconciliation Barometer | NSW AAPS | Qld MOCES |
|---|---|---|---|---|---|
| 2.1 Communication | |||||
| Interaction with health professionals | ✓ | ||||
| Information provided in a way that could be understood | ✓ | ✓ | |||
| Quality of relationship | ✓ | ||||
| 2.2 Treated respectfully | |||||
| Respect | ✓ | ||||
| Trust and confidence | ✓ | ✓ | |||
| Staff were polite and welcoming | ✓ | ||||
| Respect for cultural or religious beliefs | ✓ | ✓ | |||
| 2.3 Unfair treatment and cultural barriers | |||||
| Unfair treatment and discrimination | ✓ | ✓ | |||
| Avoided health care due to poor treatment | ✓ | ||||
| Did not access health care due to cultural reasons | ✓ | ||||
| 2.4 Empowerment | |||||
| Involved in health care decisions | ✓ | ||||
| Provided with information about patient rights | ✓ | ||||
| 2.5 Family inclusion | |||||
| Inclusion | ✓ | ||||
| 2.6 Leave events | |||||
| Admitted patient leave events | ✓ | ||||
| Emergency department leave events | ✓ |
Note: AATSHIS – Australian Aboriginal and Torres Strait Islander Health Survey; NATSIHS – National Aboriginal and Torres Strait Islander Health Survey; NATSISS – National Aboriginal and Torres Strait Islander Social Survey; NHMD – National Hospital Morbidity Database; NNAPEDCD – National Non-admitted Emergency Department Care Database; NSW Adult Admitted Patient Survey (AAPS); Queensland Maternity Outpatient Clinic Experience Survey (MOCES).
Notes
The ABS national survey data sources were:
- Australian Aboriginal and Torres Strait Islander Health Survey (AATSIHS) in 2012–13
- National Aboriginal and Torres Strait Islander Health Survey (NATSIHS) in 2018–19
- National Aboriginal and Torres Strait Islander Social Survey (NATSISS) in 2014–15.
These surveys include data that relate to the domains of communication, respectful treatment and unfair treatment. The national ABS Patient Experience Survey (PES), which includes data related to communication and respectful treatment by general practitioners, is not available by Indigenous status. More information on ABS social and health surveys of Indigenous Australians is found in the Data sources and quality page of the Aboriginal and Torres Strait Islander Health Performance Framework.
Most jurisdictions undertake surveys about patients’ experiences in public hospitals, but there is not a lot of publicly released data on Indigenous patients and their experiences.
The NSW Bureau of Health Information (BHI) collects and publishes data about the experiences of people admitted to NSW public hospitals. Data are reported for New South Wales from the Adult Admitted Patient Survey, a survey of patients who have recently been admitted to a NSW public hospital.
| Year | Aboriginal and/or Torres Strait Islander respondents |
|---|---|
| 2014 | 2,682 |
| 2018 | 443 |
| 2019 | 3,454 |
| 2020 | 364 |
| 2021 | 551 |
Note: Aboriginal and/or Torres Strait Islander respondents oversampled in 2014 and 2019 surveys.
This report used data from the 2014, 2018, 2019, 2020 and 2021 surveys downloaded from the BHI’s interactive data portal (previously hosted on the BHI Healthcare Observer). The NSW BHI also released a detailed report in 2021, Aboriginal people’s experiences of hospital care, focussing on Aboriginal and Torres Strait Islander patient experiences using data from various BHI surveys in 2019. Some highlights from Aboriginal people’s experiences of hospital care report are presented in this report.
The Queensland Maternity Outpatient Clinic Patient Experience Survey includes Aboriginal and Torres Strait Islander specific questions. Data on Aboriginal and Torres Strait Islander women are available from the 2015 (350 women) and 2017 (390 women) surveys. For more information see the 2017 Maternity Outpatient Clinic Patient Experience Survey Report. This survey has been discontinued.
Patient Reported Experience Measures (PREMs) and Patient Reported Outcome Measures (PROMs) surveys could provide another opportunity to collect data on Indigenous patients’ experiences of health care. The collection of patient reported data through standardised PREMs and PROMs for Indigenous health care users needs to consider cultural adaptability of these tools and development work is underway to address this at hospital and primary health care service levels for accountability and continued quality improvement.
Reconciliation Australia’s Australian Reconciliation Barometer (ARB) was developed as a tool to measure the progress of reconciliation between Indigenous and non-Indigenous Australians. The first study was completed in 2008, with biennial reports since then. The results of surveys prior to 2014 are no longer included in the ARB, so that applicable tracking results are more directly comparable. For the 2014, 2016, 2018, 2020 and 2022 surveys, the Indigenous community sample ranged between 495 and 532, and the general community sample between 1,100 and 2,522. The general sample also includes Australians who are Indigenous or have Aboriginal and/or Torres Strait Islander heritage. Both the general and Indigenous samples are weighted to be representative in terms of age group, gender and location (state and territory populations), as per ABS 2016 Census data. Data from the 2020 report covers the period to July 2020 and therefore some responses to the survey questions may be in reference to approximately the first six months of the COVID-19 pandemic in Australia.
The two final measures in this module for leave events used data from the national hospitals and national emergency care data collections. See the Data sources and data gaps section in Module 3 for more information on hospital data collections.
Data gaps
Major data gaps in this module are the lack of hospital patient experience data from most jurisdictions, as well as data on patients of non-hospital health care services such as primary health care and specialist services. Regular, national data collections of Indigenous patient experiences are needed to enable monitoring of the impact of government initiatives and measuring of progress in achieving cultural safety. Such data collections should allow for reporting across small areas and in different health sectors.


