Causes of injury
External cause is the circumstance in which an injury has occurred, such as a fall or transport crash. In 2021–22, almost all injury hospitalisations among children had an external cause recorded (99.98%), however no nationally comparable external cause data is available for emergency department (ED) presentations due to differences in state/territory data collection methods.
All figures presented in this chapter are for children and adolescents aged 0–18 years for hospitalisations only. Rate comparisons between child age groups and adults can be found in Injuries by developmental stage.
For external cause group inclusions, see Technical notes.
The top 3 leading causes of injury hospitalisation in 2021–22 were:
- falls (33%, 29,000 cases), which can include falling from playground equipment, rolling off furniture, or tripping on a flat surface
- contact with objects (20%, 17,400 cases), which can include being hit by a flying ball, or having fingers jammed in a door
- transport (14%, 12,000 cases), which can include being injured while on a pedal cycle, on a motorbike or in a car.
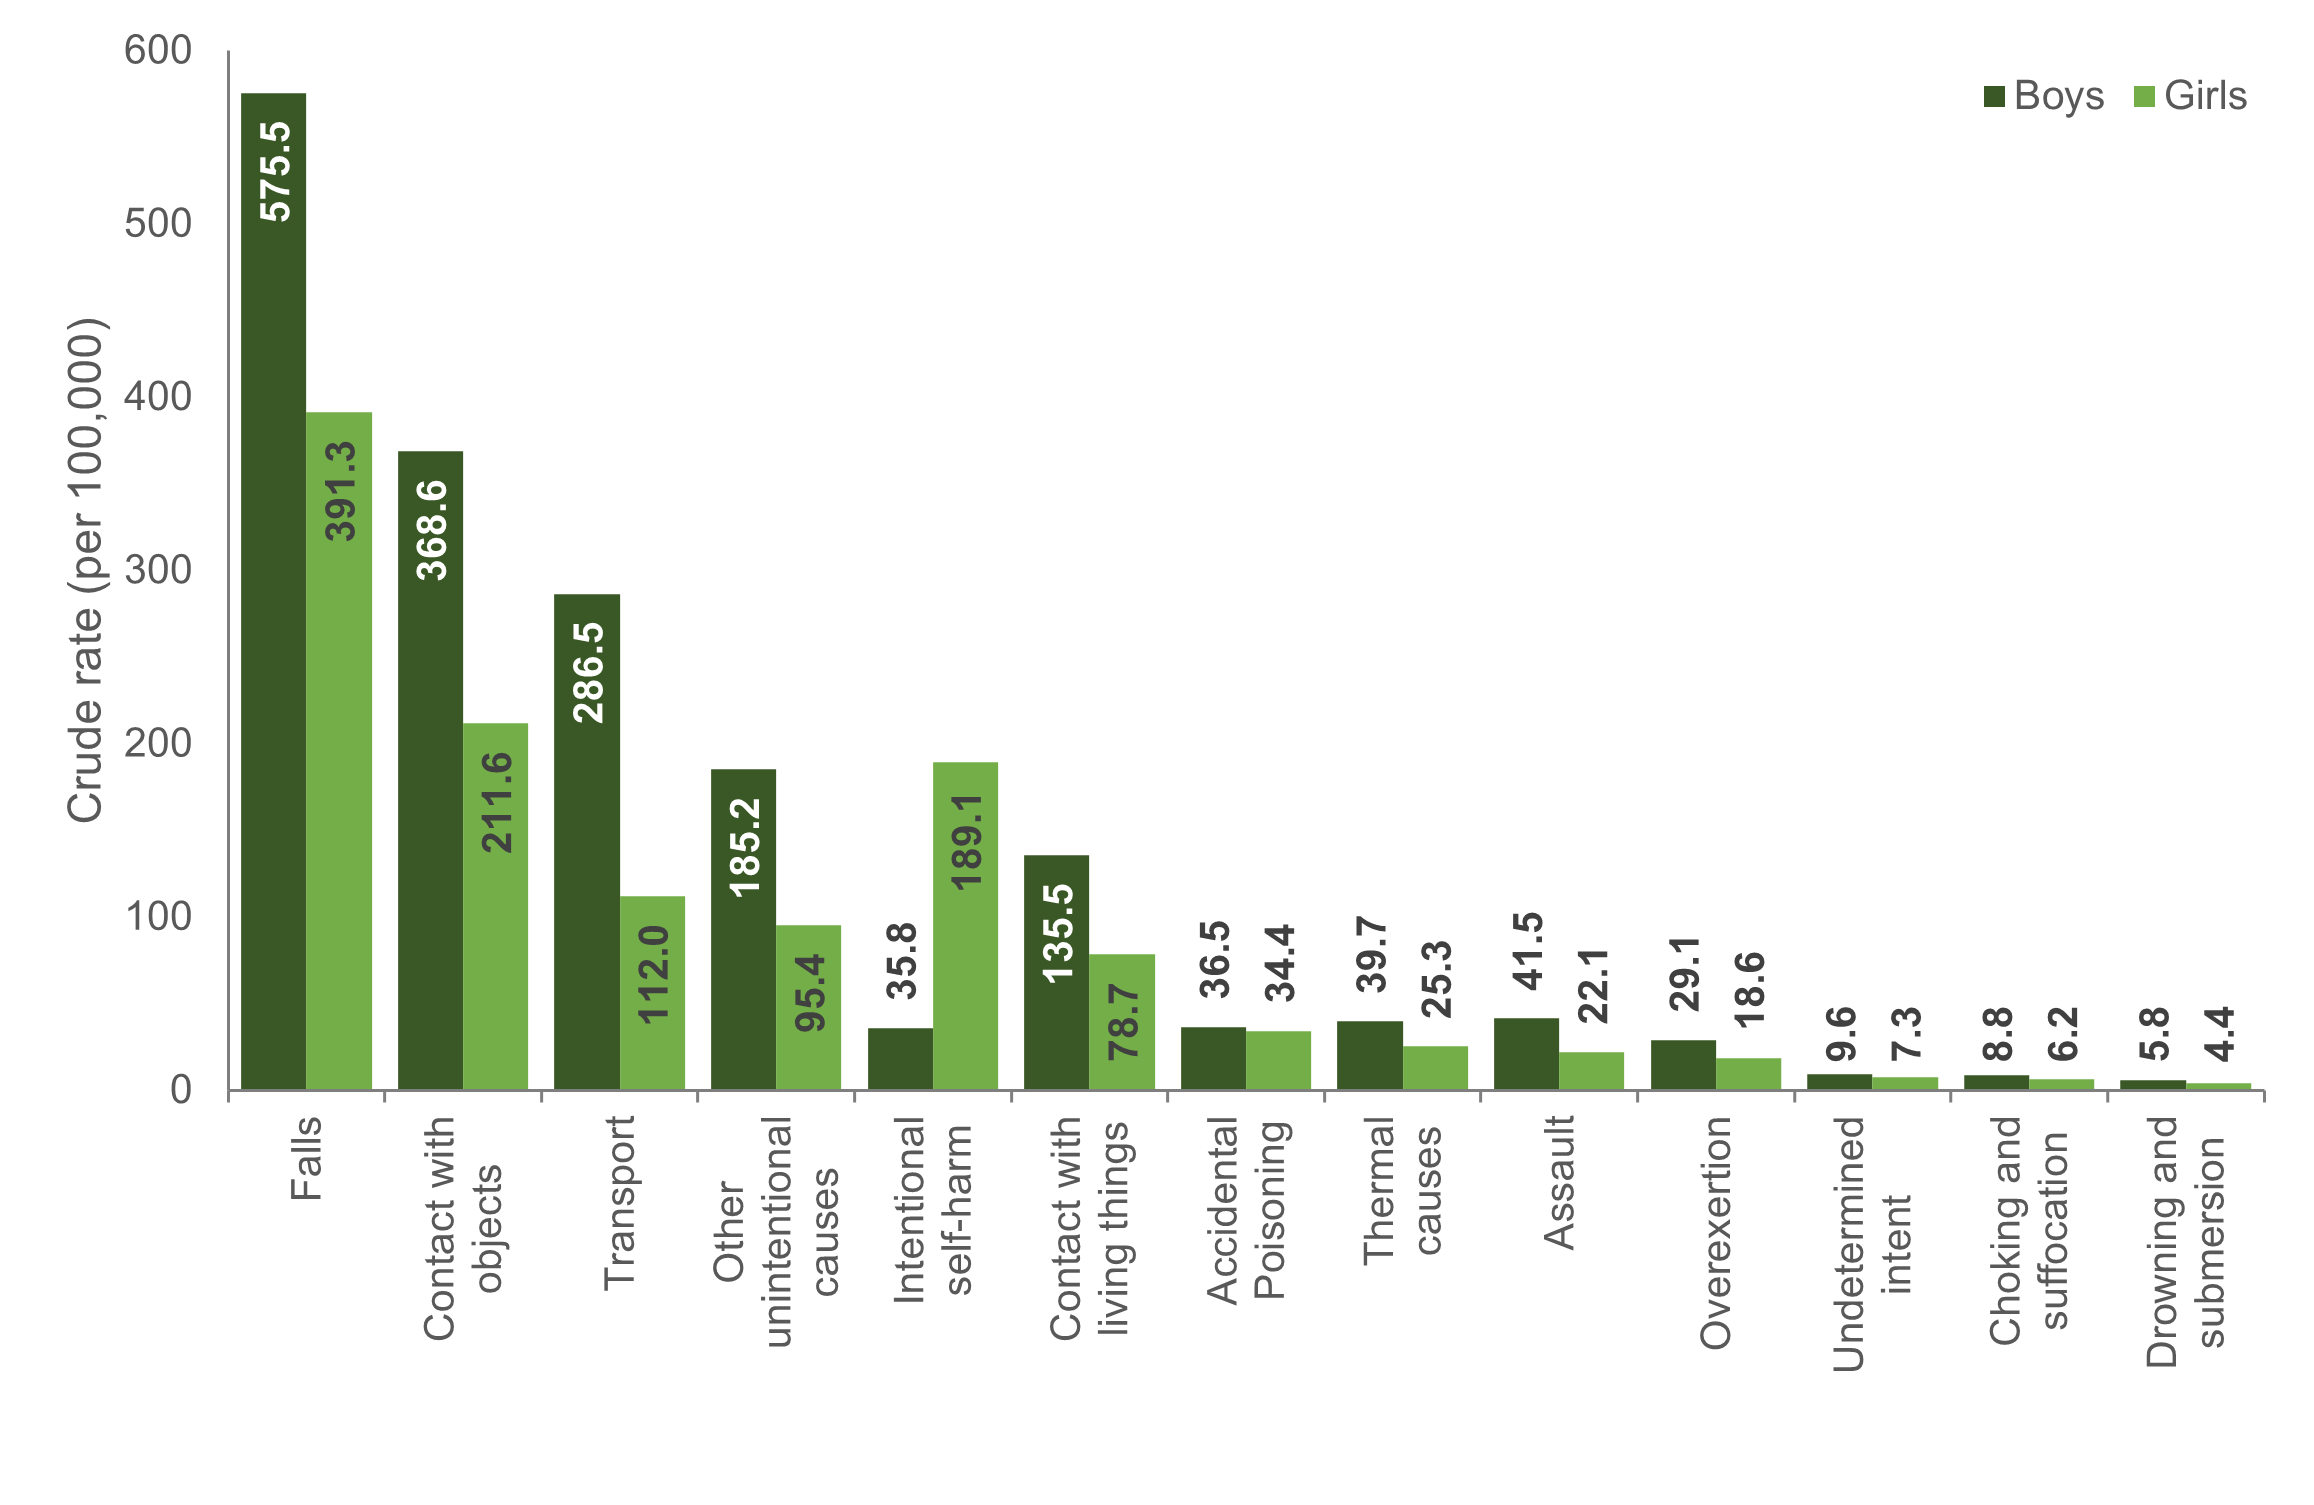
Boys had higher rates of injury hospitalisation across all causes apart from:
- intentional self-harm, where girls were 5 times more likely to be hospitalised than boys (190 and 36 per 100,000 respectively)
- forces of nature, where rates are comparable
- accidental poisoning, where rates are comparable (Figure 9).
Figure 9: Number and crude rates (per 100,000) of injury hospitalisations among children, by external cause and sex, Australia, 2021–22
Notes:
- Rates are crude per 100,000 population.
- Only includes records where the patient was between 0 and 18 years of age.
- Excludes causes where rates could not be calculated due to data volatility and small numbers.
Sources: AIHW National Hospital Morbidity Database (NHMD) and ABS National, state and territory population.
For more information, refer to supplementary data tables A4 and A5.
1 in 3 hospitalisations were caused by a fall
Falls caused the highest number and rate of injury hospitalisations across all child age groups, except for 16–18 year-olds, where transport was the leading cause (supplementary data tables A4 and A5).
Falls involving playground equipment was the most common type of fall amongst children (87 per 100,000 population), with rates being highest among children aged 5–9 years (192 per 100,000).
Infants are particularly vulnerable to specific types of falls; nearly 1 in 4 falls involved a bed (24%), and over 1 in 5 were while being carried or supported by other persons (21%). In contrast, the most common type of fall for 13–15 and 16–18 year-olds was due to a collision with, or pushing by another person. Overall, adults are over twice as likely as children to be hospitalised for a fall (1,000 and 490 per 100,000 respectively).
Older children are overrepresented across most cause types
The 16–18 years age group had the highest rates of injury hospitalisation overall (2,200 per 100,000), and across most cause groups. Children aged 1–4 years also had high rates of injury across multiple cause groups as compared to children of other ages.