Variation between population groups
All figures presented in this chapter are for children and adolescents aged 0–18 during 2021–22 only. Comparisons between child age groups and adults can be found in Injuries by developmental stage.
We note that the ‘sex’ variable currently available for national hospitals reporting only comprises of 4 categories – male, female, intersex or indeterminate, and not stated/inadequately described – and is referring to the biological sex only. Work is underway to include more comprehensive coverage of sex and/or gender within future reporting.
For this report, the categories of intersex or indeterminate, and not stated/inadequately described have been grouped together to assist with confidentialising the data. In addition, ‘boys’ is used to refer to children and adolescents with a biological sex of male, and ‘girls’ for a biological sex of female. Rates, based on the Australian population data held by the AIHW (sourced from the ABS), are currently only available for male and female sex categories.
Boys are injured more often than girls
In 2021–22, boys made up around 3 in 5 injury emergency department (ED) presentations (353,000, 58%) and hospitalisations (54,000, 61%) among children and adolescents. Boys had higher crude rates of injury across every age group for both hospitalisations and ED presentations, although infants (children aged under one) had comparable rates of hospitalisation between boys and girls (988 and 985 per 100,000 respectively). For more information, see supplementary table A1.
Toddlers and preschoolers present to emergency departments more often than older children
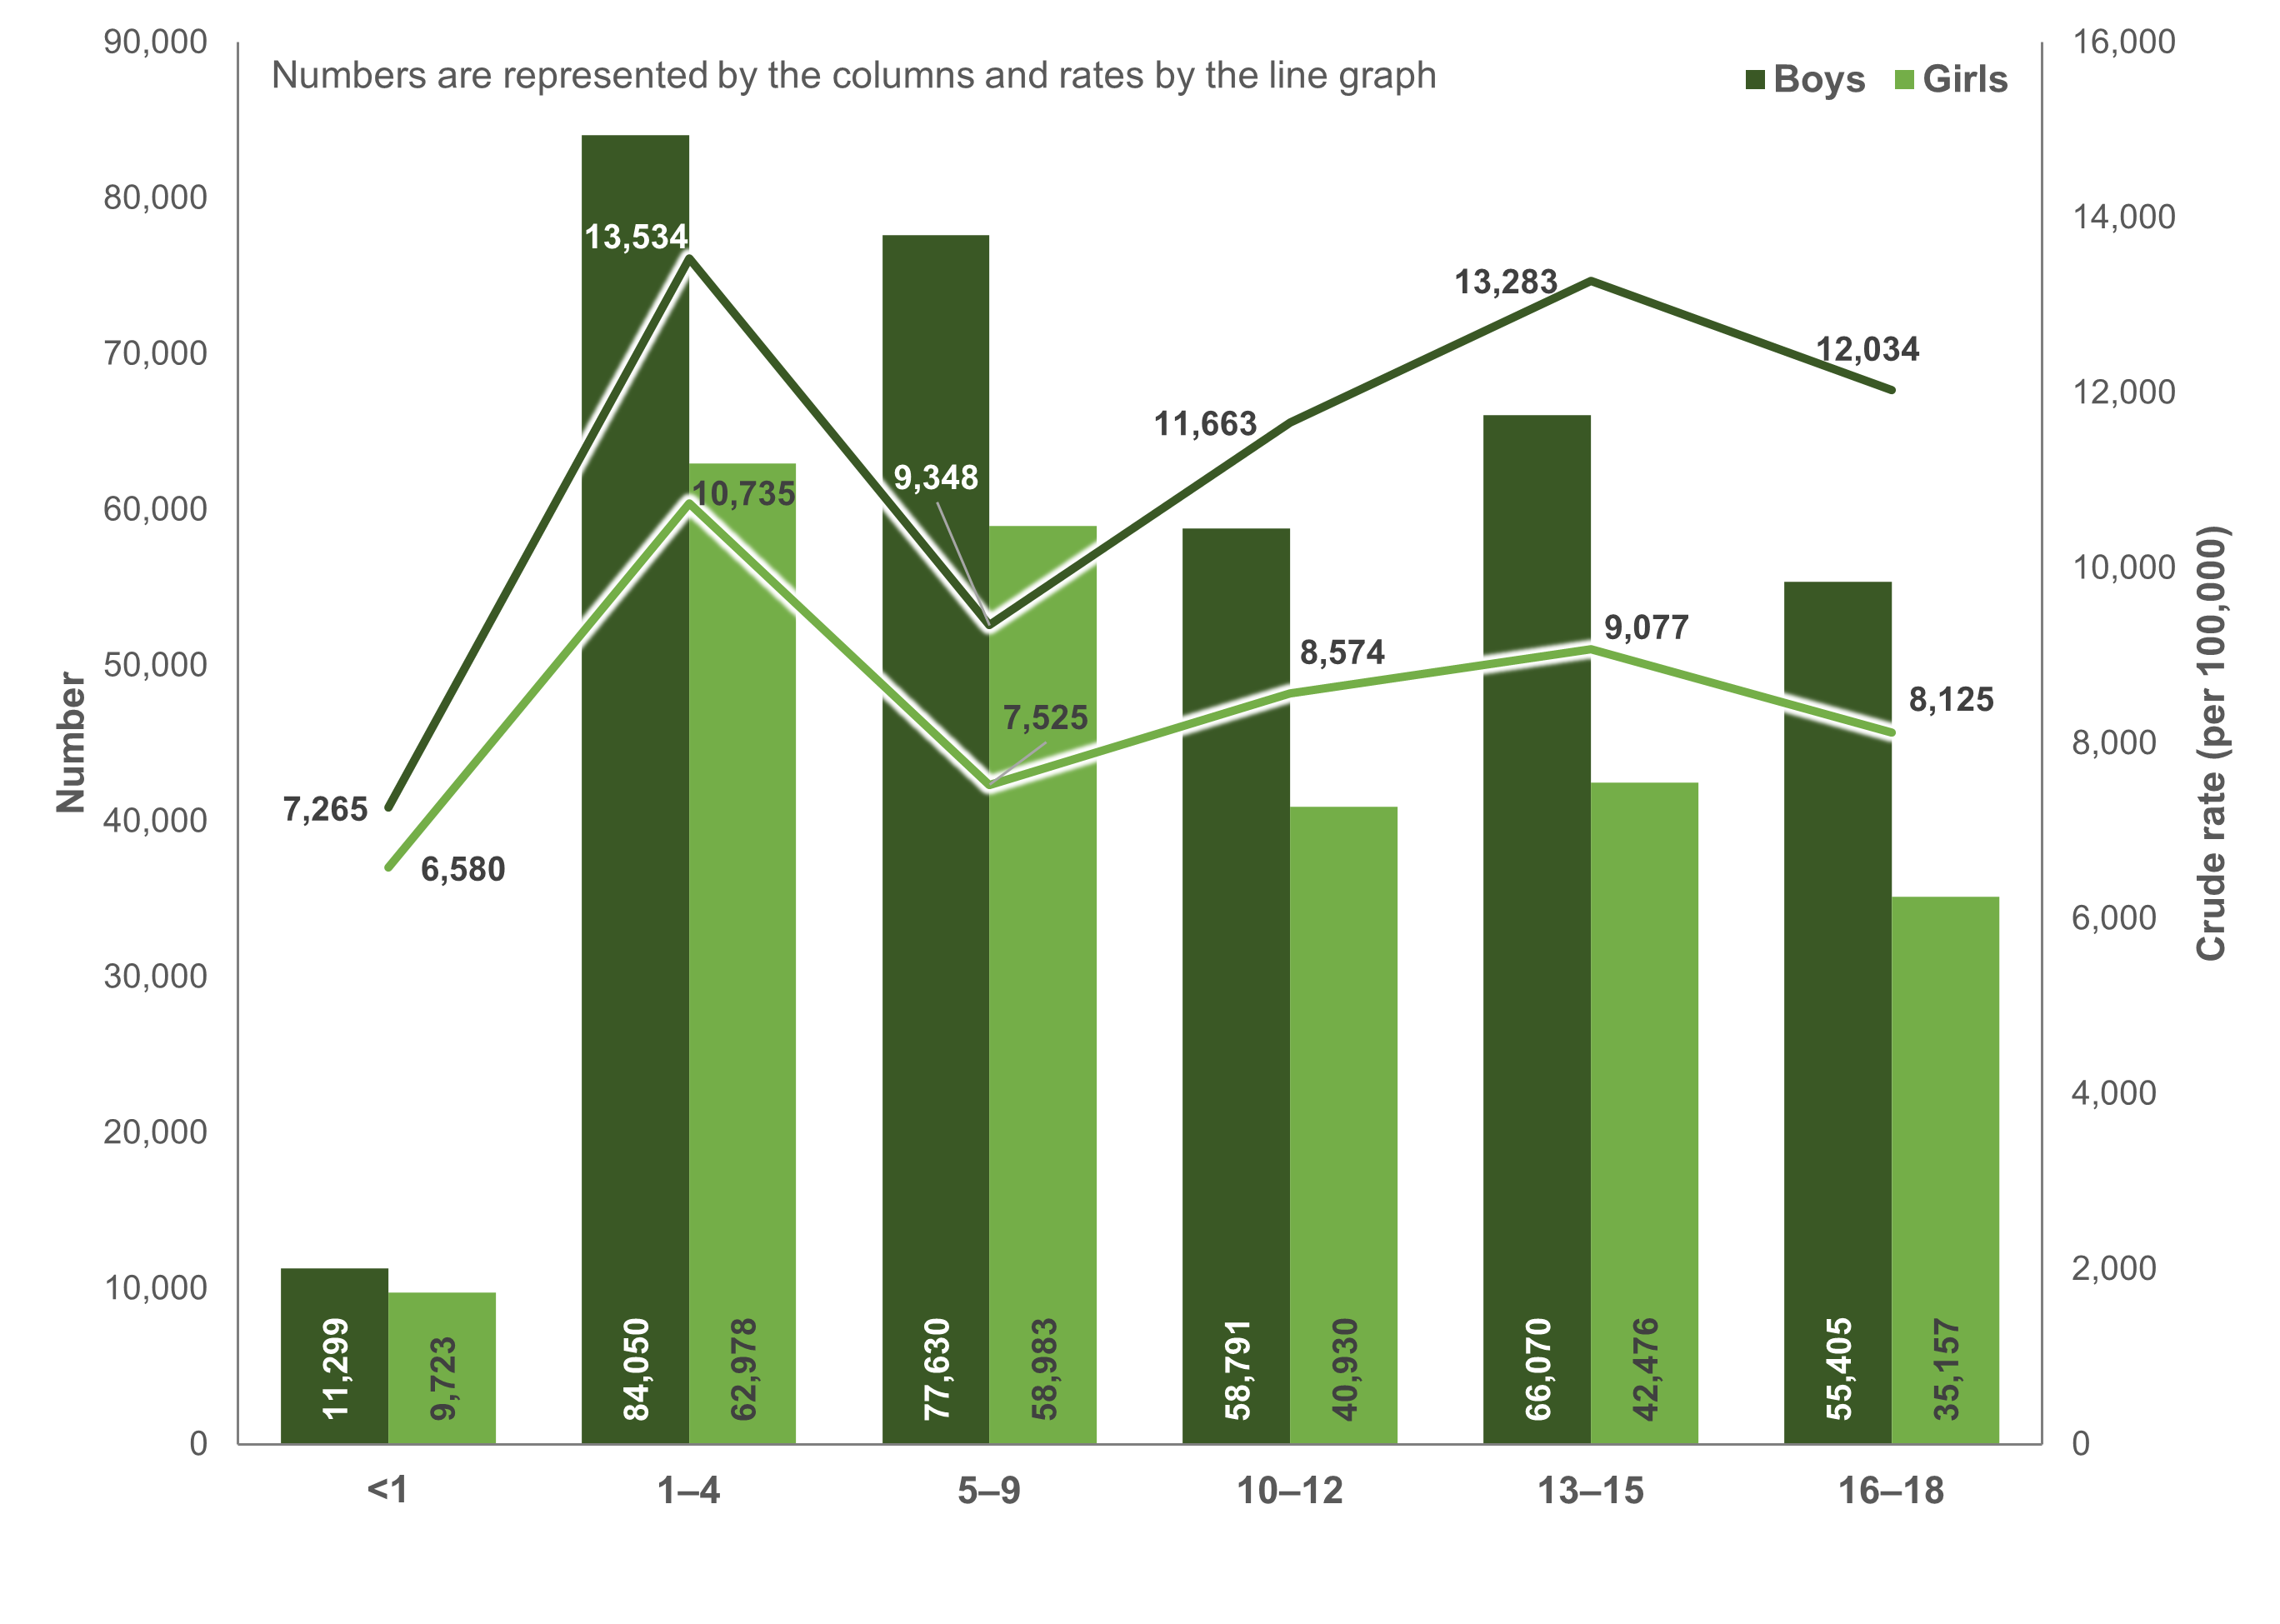
The risk of injury changes by developmental stage. Children aged 1–4 had the highest rate of ED presentation (12,200 per 100,000), with boys in this age group having the highest rate overall (13,500 per 100,000) (Figure 1).
Figure 1: Numbers and crude rates (per 100,000) of emergency department presentations for injuries among children, by age group and sex, Australia, 2021–22
Notes:
- Numbers are represented by the columns and rates by the line graph.
- Rates are crude per 100,000 population.
- Only includes ED presentations where the patient was between 0 and 18 years of age, and where sex was not intersex, indeterminate or missing.
Sources: AIHW National Non-Admitted Patient Emergency Department Care (NNAPEDC) Database and ABS National, state and territory population.
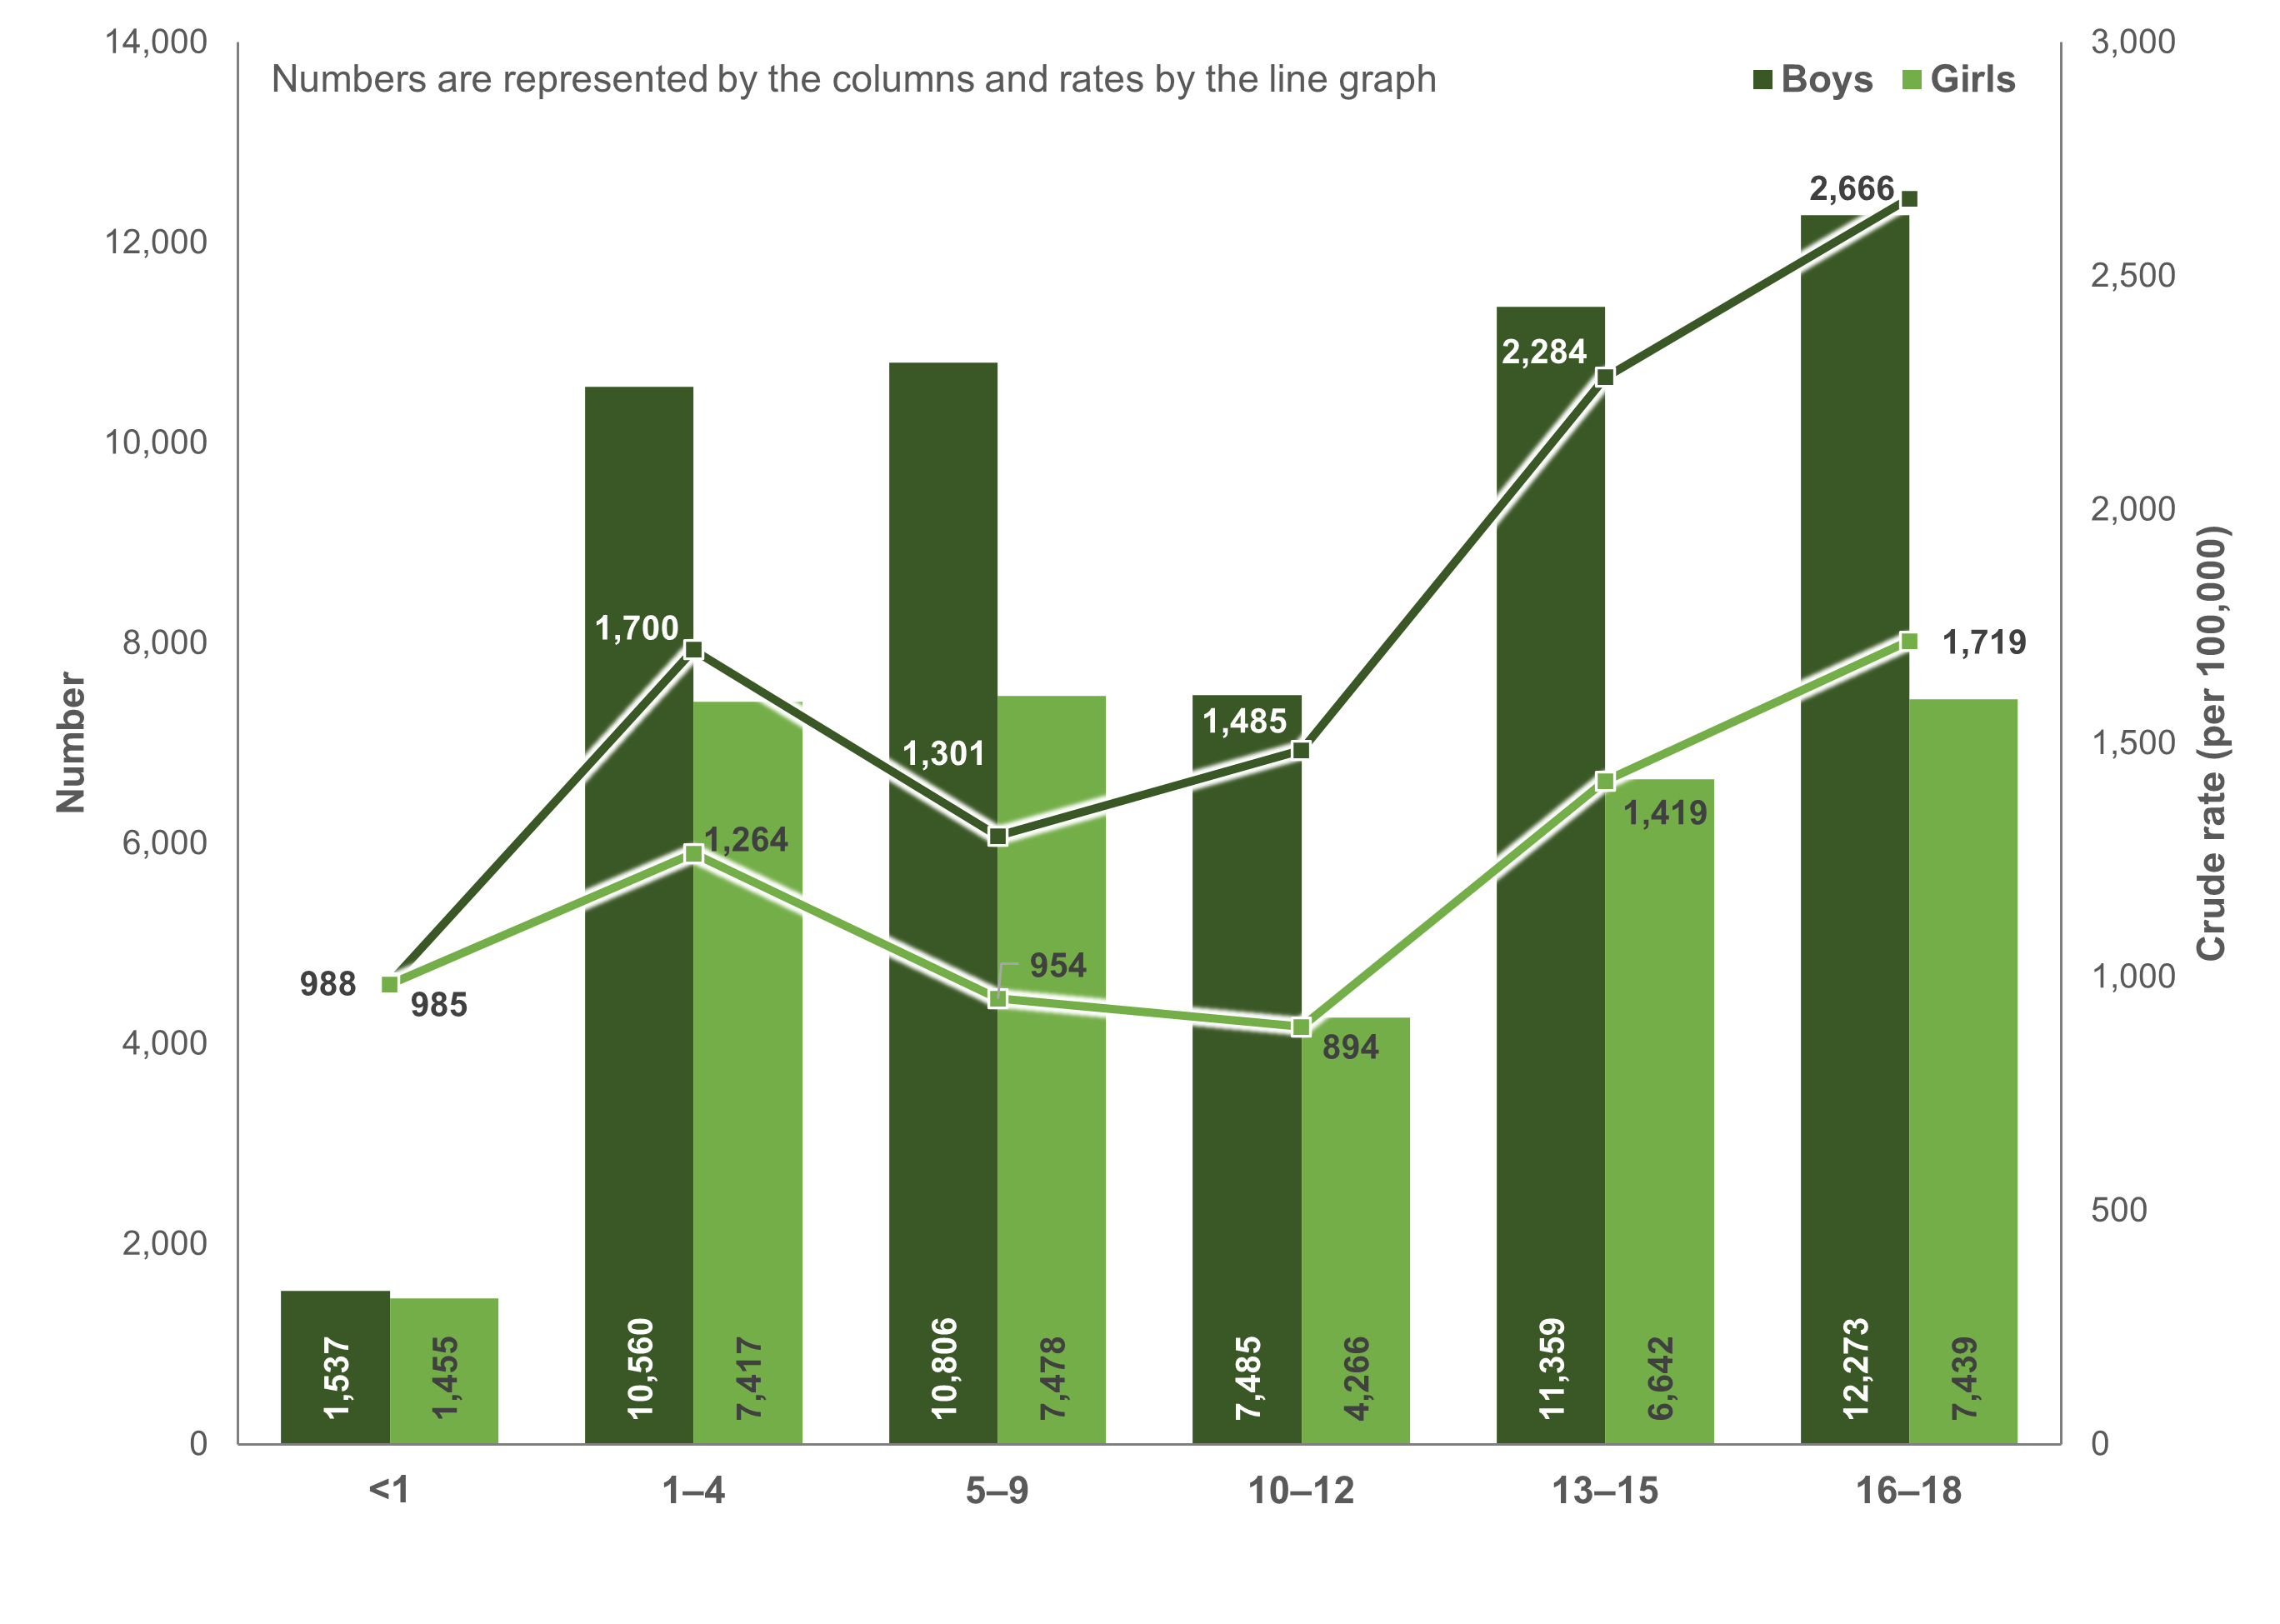
Comparatively, for injury hospitalisations the highest rate of injury (2,200 per 100,000) was among adolescents aged 16–18 (Figure 2).
Figure 2: Number and crude rates (per 100,000) of hospitalisations among children and adolescents, by age and sex, Australia, 2021–22
Notes:
- Numbers are represented by the columns and rates by the line graph.
- Rates are crude per 100,000 population.
- Only includes hospitalisations where the patient was between 0 and 18 years of age, and where sex was not intersex, indeterminate or missing.
Sources: AIHW National Hospital Morbidity Database (NHMD) and ABS National, state and territory population.
For more information, see supplementary tables A1 and D1.