Demographics
Demographics
We note that the ‘sex’ variable currently available for national hospitals reporting only comprises of two categories M (male) and F (female) and is referring to the biological sex only. Work is underway to address this shortcoming. In the future, where numbers permit, we intend to report on:
sex i.e., M (male), F (female) or X (indeterminate/ intersex/ unspecified) and/or gender i.e., Man, or boy, or male; Woman, or girl, or female; Non-binary, Different term, Prefer not to say.
Rates, based on the Australian population data held by the AIHW (sourced from the ABS), are currently only available for M (male) /F (female) sex categories.
People 45 years and over had the highest rates of ED presentations
Males accounted for a slightly smaller proportion of spinal injury ED presentations compared to all injury ED presentations (52% and 57% respectively). More than half (54%) of the 19,378 spinal injury ED presentations were for people 45 years and over.
For spinal injury ED presentations in 2020–21, when comparing age groups:
- the highest number of males was in the 25–29 age group (7.8% or 789 cases)
- the highest number of females was in the 15–19 age group (7.0% or 656 cases).
Males were overrepresented in spinal injury hospitalisations
In 2020–21, 53% of spinal injury hospitalisations were for males (14,137 cases) and 47% were for females (12,417 cases). These proportions are similar to those across the group of all injuries in Injury in Australia.
For spinal injury hospitalisations in 2020–21:
- The highest number of cases was in the 80–84 age group for both males and females (1,095 and 1,608 cases, respectively).
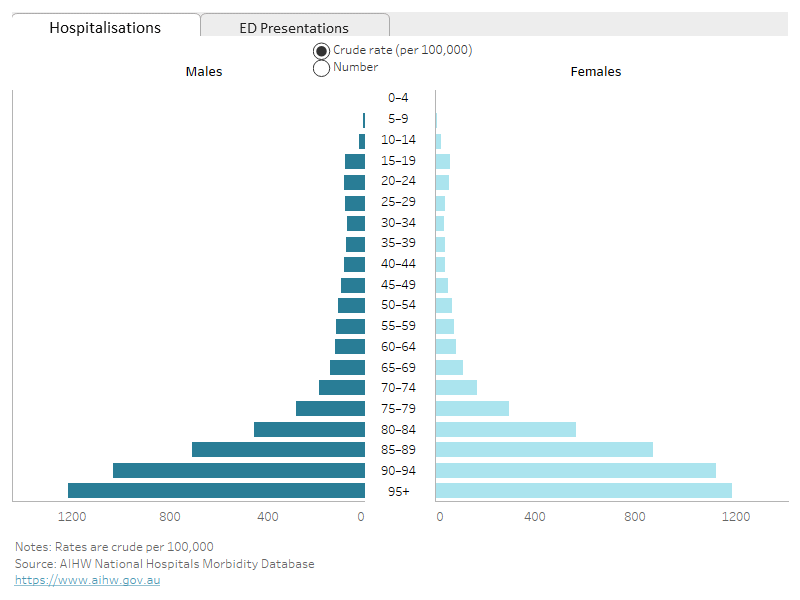
- Within each age group, males had higher rates of hospitalisations than females. The exception to this was the 75 years and older age groups, where rates of hospitalisations were higher for females (Figure 2).
Overall, rates of injury hospitalisations across Australia tended to be higher in males, and from around age 65, rates per 100,000 population rise dramatically for both males and females (293.5 and 342.4 respectively).
Rates of spinal injury varied between males and females and across different age groups, with certain causes of injury posing a higher risk for younger males, while other causes were more likely to affect older females.
Figure 2: Number and rate of spinal injury hospitalisations and ED presentations, by age group and sex, 2020–21
A butterfly chart showing the number and rate of spinal injury ED presentations and hospitalisations by age group and sex. The crude rate (per 100,000) of spinal injury hospitalisations tended to increase with age and was generally higher for males than females, with the highest for both males and females in the 95 and over age group. Similarly for ED presentations, the crude rate (per 100,000) of spinal injury ED presentations tended to increase with age, with the highest in the 95 and over age group. Rates were generally higher for males.


