Trends over time
Spinal injury hospitalisations have increased over the past decade
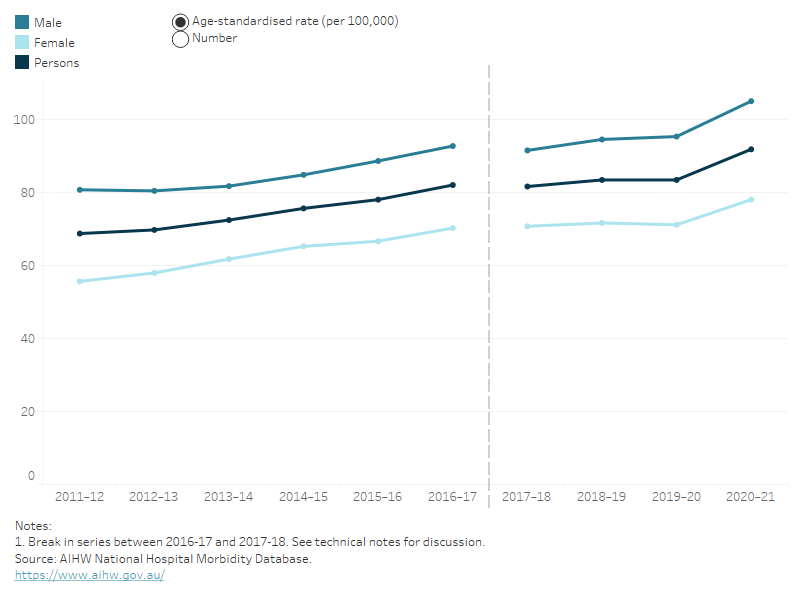
Hospitalisation data are divided into two distinct time periods: 2010–11 to 2016–17 and 2017–18 to 2020–21. Comparisons of hospitalisations data between these two time periods is not recommended due to a change in data collection methods between 2016–17 and 2017–18 (see technical notes for more details). Comparisons presented here are for within each of the two time periods.
Over the period from 2017–18 to 2020–21, the rate of hospitalisations increased by an annual average of 4%. A similar increase was seen over 2011–12 to 2016–17 where the rate of hospitalisations increased by an annual average of 3.6%.
The age-standardised rate of spinal injury hospitalisations in 2020–21 was 8.8% higher than a year earlier. This followed a dip the previous year that appears to mostly have been caused by COVID-19 restrictions.
Figure 8: Age–standardised rate and number of spinal injury hospitalisations, by sex, 2011–17 to 2017–21
Line chart showing change in the number and rate of spinal injury hospitalisations from 2011-12 to 2016-17, and from 2017-18 to 2020-21. Over the two separate periods, the rates and numbers of spinal injuries have increased.


